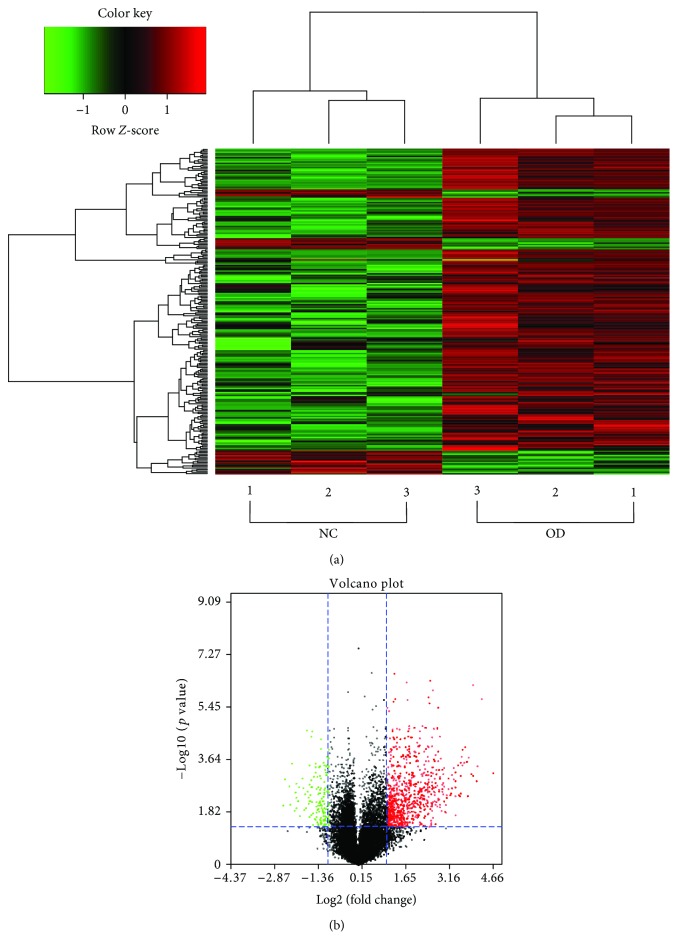
Figure 5.
The miRNA differential expression profiles in exosomes. (a) The heat map of distinct miRNAs in exosomes derived from undifferentiated and osteogenically differentiated ADSCs based on microarray. (b) The volcano plot of miRNAs in exosomes derived from undifferentiated and osteogenically differentiated ADSCs. The red dots represent upregulation, and the green dots represent downregulation of expression with statistical significance (fold change ≥2, p value < 0.05). Notes: NC: normal control (exosomes derived from undifferentiated ADSCs); OD: osteogenic differentiation (exosomes derived from osteogenically differentiated ADSCs).

