Figure 3.

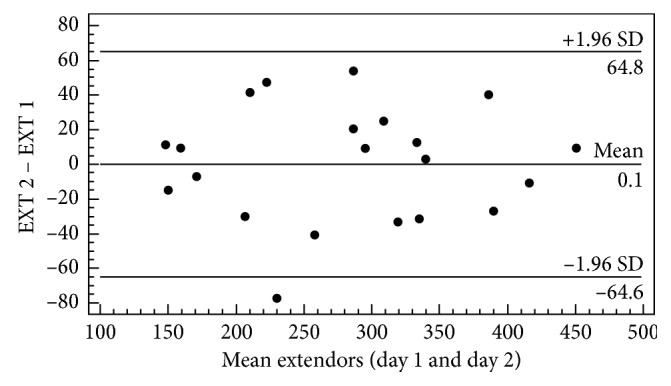
Graphical representation of Bland–Altman plot for visualization of the differences and averages between the first and second day of evaluation, obtained by the maximum strength (N) of the muscle trunk extensors (EXT) (n=21).

Graphical representation of Bland–Altman plot for visualization of the differences and averages between the first and second day of evaluation, obtained by the maximum strength (N) of the muscle trunk extensors (EXT) (n=21).