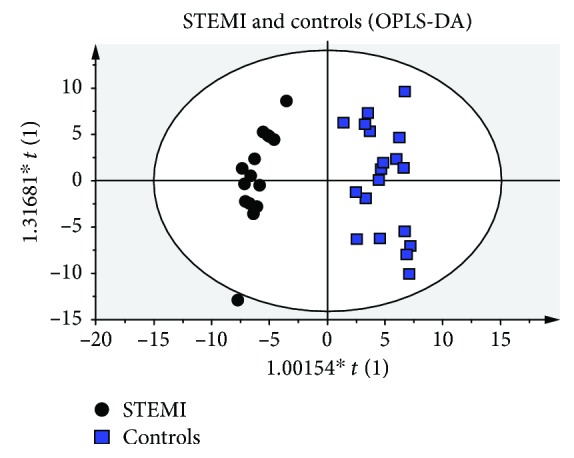
Figure 3.

Score plots of orthogonal projection to latent structures discriminant analysis (OPLS-DA) results. Score plots discriminating the metabolic profiles in plasma samples between patients with STEMI versus controls. The parameters of the model were as follows: 2 PCs, R 2 = 0.93, and Q 2 = 0.771.
