Figure 1.
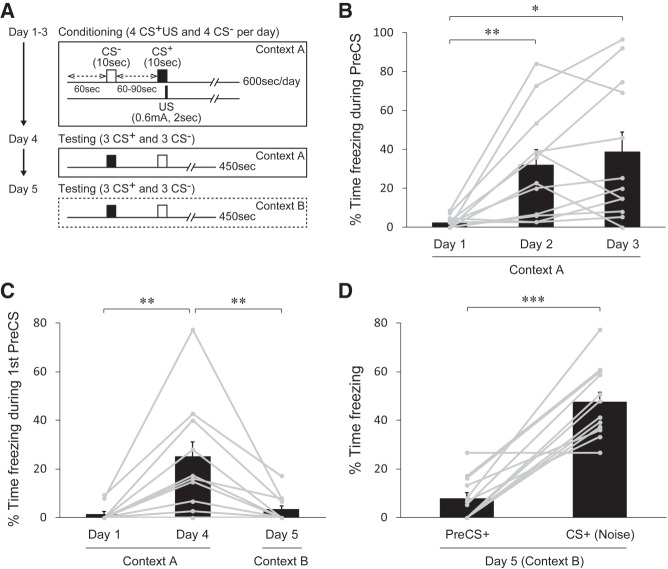
Contextual and cued fear in a discriminative AFC paradigm. (A) Schematic diagram of the experimental protocol for 3-d conditioning in context A (day 1–3) followed by the first testing session in context A (day 4) and the second testing session in context B (day 5). (B) Percentage of time spent freezing during the time prior to the CSs (PreCS) for each conditioning session (day 1–3). Significant increase in the freezing level on day 2 indicates acquisition of contextual fear. Gray dots with lines represent the median of data sets from eight trials per day (including the CS+ and CS− trials) for individual mice (n = 12 mice). (C) Percent time spent freezing during the PreCS of the first trial of the session on day 1 (Context A), day 4 (Context A), and day 5 (Context B) that represents contextual fear memory. The freezing level is significantly higher on day 4 but no difference is found on day 5 compared to that on day 1. Gray dots with lines represent data from individual mice. (D) Percent time spent freezing in trials with the CS+ in the testing session on day 5 (in a novel spatial context). The freezing level is markedly higher during the CS+ than during the PreCS+, indicating fear elicited by the CS+. Gray dots with lines represent the median of data sets from three trials with the CS+ for individual mice. All data in bar graphs are depicted as mean ± SEM. (*) P < 0.05, (**) P < 0.01, (***) P < 0.001. P values were obtained using the Bonferroni's multiple comparison test (B,C) and a paired t-test (D).

