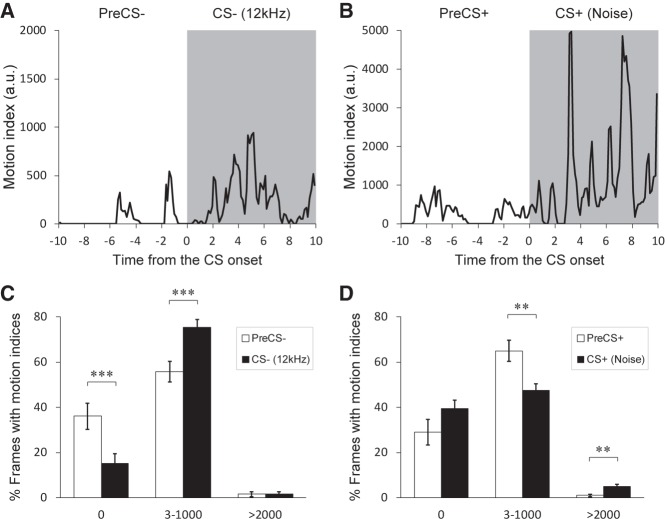
Figure 3.
Distinct behavioral expressions in response to the CS− and the CS+. (A) A typical example of the motion indices during a trial with the 12 kHz tone CS− (including the period of PreCS− for 10 sec) in a testing session on day 4. The gray area represents the period of CS− presentation. The motion indices less than 1000 appear more frequently in the CS− period than in the PreCS− period. (B) A typical example of the motion indices during a trial with the white noise CS+ (including the period of PreCS+ for 10 sec) in a testing session on day 4. The gray area represents the period of CS+ presentation. The motion indices more than 2000 appear in the CS− period. (C) Comparison of the appearance of mouse movements with different motion indices between the PreCS− and the tone CS− in the testing session on day 4. The vertical axis represents the percent pixels (time) showing each motion index range (0, 3–1000, or >2000). The percentage of time with the motion index 0 is significantly lower during the CS− than during the PreCS−, while that with the motion indices ranging 3–1000 is significantly higher during the CS− than during the PreCS−. No significant difference is seen for the motion indices more than 2000. (D) Comparison of the appearance of mouse movements with different motion indices between the PreCS+ and the noise CS+ in the testing session on day 4. The percentage of time with the motion index more than 2000 is significantly higher during the CS+ than during the PreCS+, while that with the motion indices ranging 3–1000 is significantly lower during the CS− than during the PreCS−. No significant difference is seen for the motion index 0. All data in bar graphs are depicted as mean ± SEM (n = 12 mice). (**) P < 0.01, (***) P < 0.001. All P values were obtained using a paired t-test.

