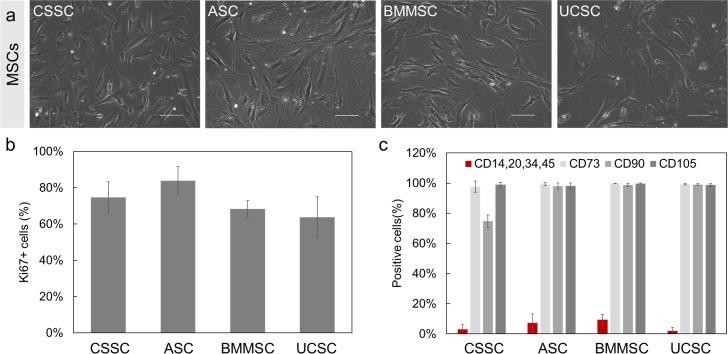
Figure 1.
Morphology and characterization of the different MSCs investigated. (a) Phase-contrast images of MSCs: CSSC, ASC, BMMSC, and UCSC. Scale bar: 100 μm. (b) Proliferation of the MSCs: Ki67 proliferation marker was quantified by computing the percentage of number of Ki67-positive cells per number of 4′,6-diamidino-2-phenylindole positive cells using immunofluorescence staining. (c) Phenotyping of the MSCs was carried out by flow cytometry analysis of surface antigens CD73, CD90, CD105 (positive surface markers) and CD34, CD14, CD20, CD45 (negative surface markers, in red). Results are expressed as mean ± SD (n = 3 independent experiments). N = 2 cell lines for BMMSCs and UCSCs.

