Figure 2.
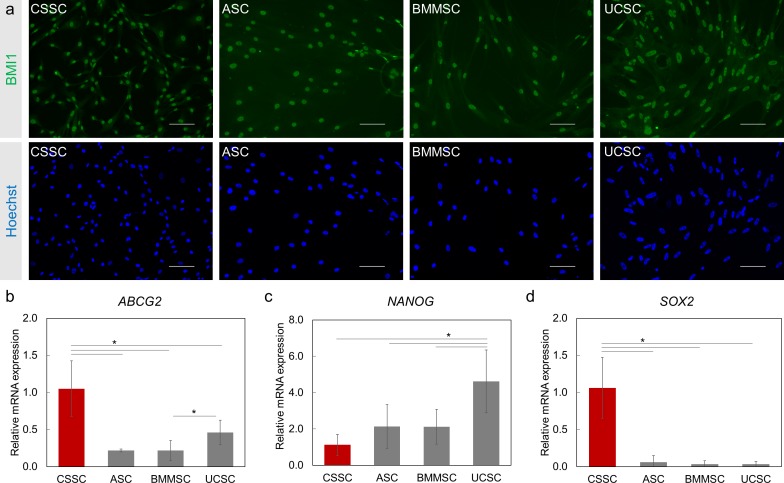
Expression of stem cell/progenitor cell markers in MSCs. (a) The stem cell marker BMI1 (green) expression is observed in all MSCs. Nuclei are counterstained with Hoechst (blue). Scale Bar: 100 μm. (b–d) Relative mRNA expression of stem cell/progenitor markers ABCG2 (b), NANOG (c), and SOX2 (d) in MSCs was measured by RT-PCR. Gene expression was normalized to CSSC (red bars). N = 2 cell lines for BMMSCs and UCSCs. Results are expressed as mean ± SEM. Statistical analysis: ANOVA comparison of the means, followed by Tukey's test. *P < 0.05.

