Figure 3.
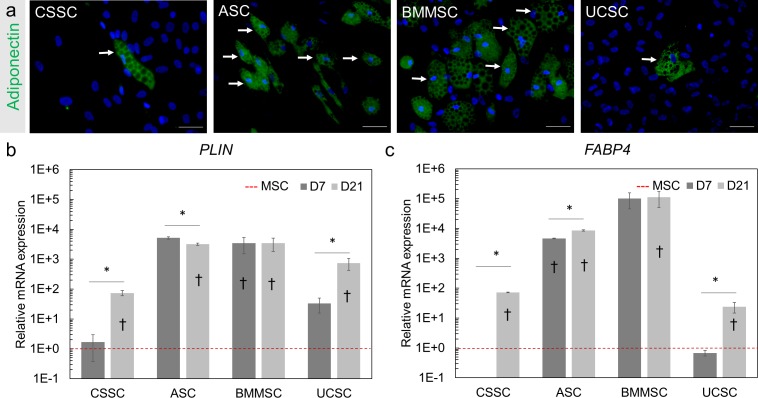
Adipogenic differentiation potential of the MSCs. (a) Lipid aggregations were visualized by immunofluorescence staining of adiponectin (green) in MSCs after 21 days of differentiation. Hoechst was used as nuclear counterstaining (blue). White arrows indicate examples of the observed lipid vacuoles. Scale Bar: 50 μm. (b, c) Gene expression analysis of the adipose-related markers PLIN (b) and FABP4 (c) was performed by RT-PCR for the MSCs at day 7 (D7) and day 21 (D21) of adipogenic differentiation. Gene expression was normalized to the undifferentiated parental cells (MSC, red dotted line set at 1). Results are expressed as mean ± SEM. N = 2 cell lines for BMMSC and UCSC. Statistical analysis: ANOVA followed by Tukey's test comparison of means. *P < 0.05; †P < 0.05 comparison to the respective undifferentiated MSCs.

