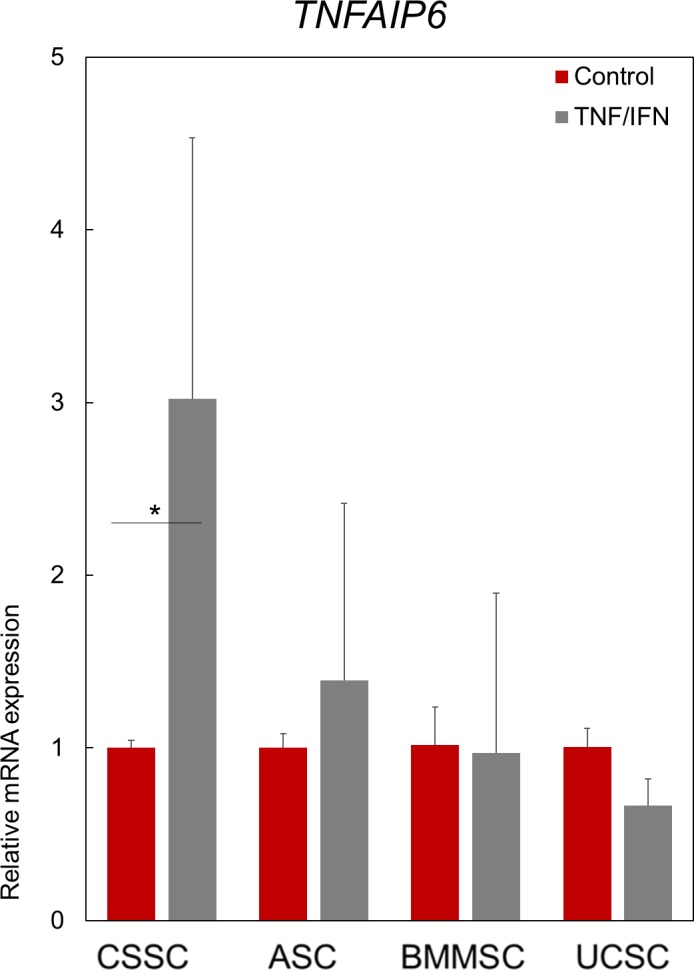
Figure 7.

The response of MSCs to proinflammatory cytokines. Anti-inflammatory response of the MSCs to by proinflammatory cytokines IFN-γ and TNF-α as quantified by TNFAIP6 transcript analysis. Data are normalized to the respective unstimulated cells (control, red bars set at 1). Results are expressed as mean ± SEM. N = 2 cell lines for BMMSC and UCSC. Statistical analysis: ANOVA followed by Student's t-test comparison of means. *P < 0.05.
