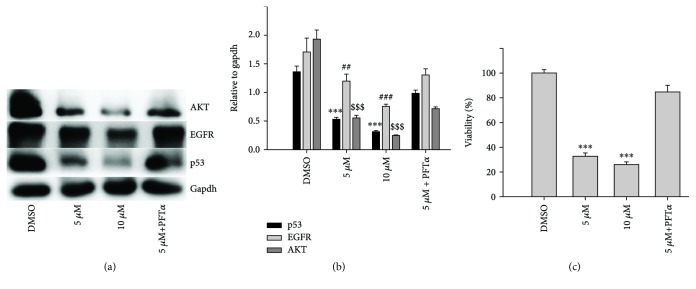
Figure 8.
p53 downregulation was associated with EGFR and AKT downregulation. (a) Western blotting analysis in the given condition; (b) quantitative analyses of alteration of EGFR, p53, and AKT in the presence or absence of PFT-α (from twice measurements). (c) DpdtbA-induced growth inhibition correlated with p53 downregulation. And the quantitative analysis was based on quartic measurements. ## p < 0.05, ∗∗∗ ,###,$$$ p < 0.01.

