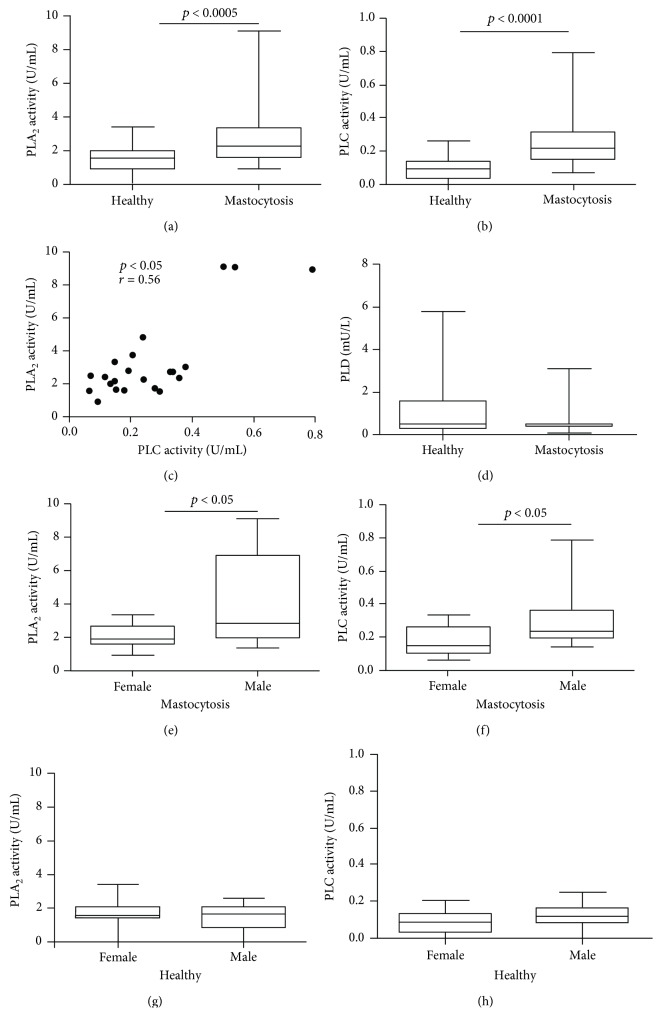
Figure 1.
Activity of PLA2, PLC, and PLD in plasma of patients with mastocytosis and healthy controls. Data are shown as the median (horizontal black line), the 25th and 75th percentiles (boxes), and the 5th and 95th percentiles (whiskers) of 23 healthy controls and 23 mastocytosis patients for PLA2 (a), PLC (b), and PLD (d) assessment. Correlation between PLA2 and PLC (c) was assessed by Spearman's correlation analysis and reported as coefficient of correlation (r). PLA2 and PLC were measured in mastocytosis females and males (e, f) and healthy females and males (g, h).

