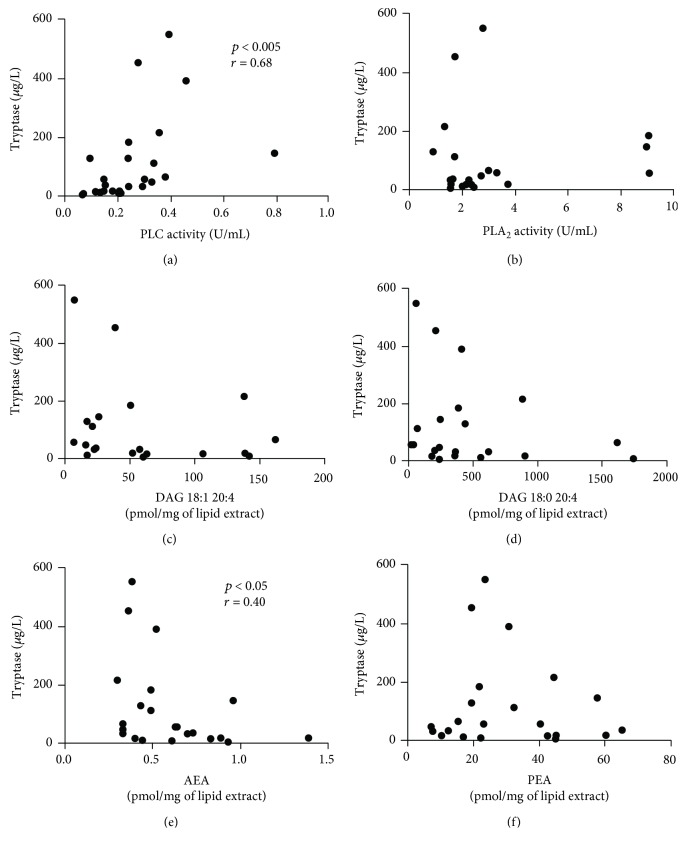
Figure 4.
Relationships among PLC, PLA2, DAG, ECs, and tryptase concentrations. Correlations between two variables (PLC and tryptase (a), PLA2 and tryptase (b), DAG 18:1 20:4 and tryptase (c), DAG 18:0 20:4 and tryptase (d), AEA and tryptase (e), and PEA and tryptase (f)) were assessed by Spearman's correlation analysis and reported as coefficient of correlation (r). p value < 0.05 was considered statistically significant.

