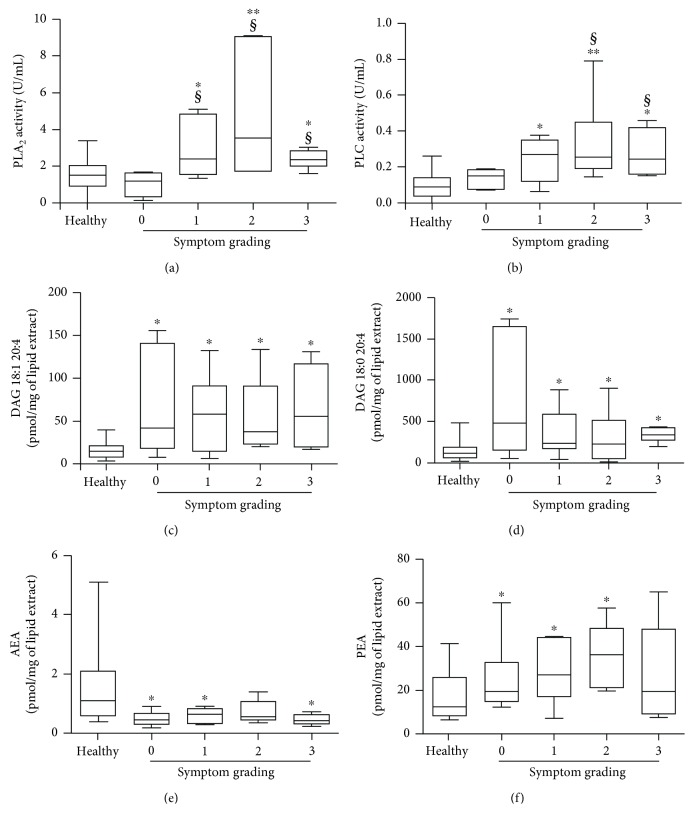
Figure 5.
Relationships among PLA2, PLC, DAG, AEA, and PEA and symptom grading. PLA2 (a), DAG 18:1 20:4 (b), DAG 18:0 20:4 (c), PLC (d), AEA (e), and PEA (f) were determined in six patients with symptom grading 0, seven patients with grading 1, five patients with grading 2, and five patients with grading 3. ∗ p value < 0.05 and ∗∗ p value < 0.01 vs. healthy controls. § p value < 0.01 vs. patients with symptom grading 0.

