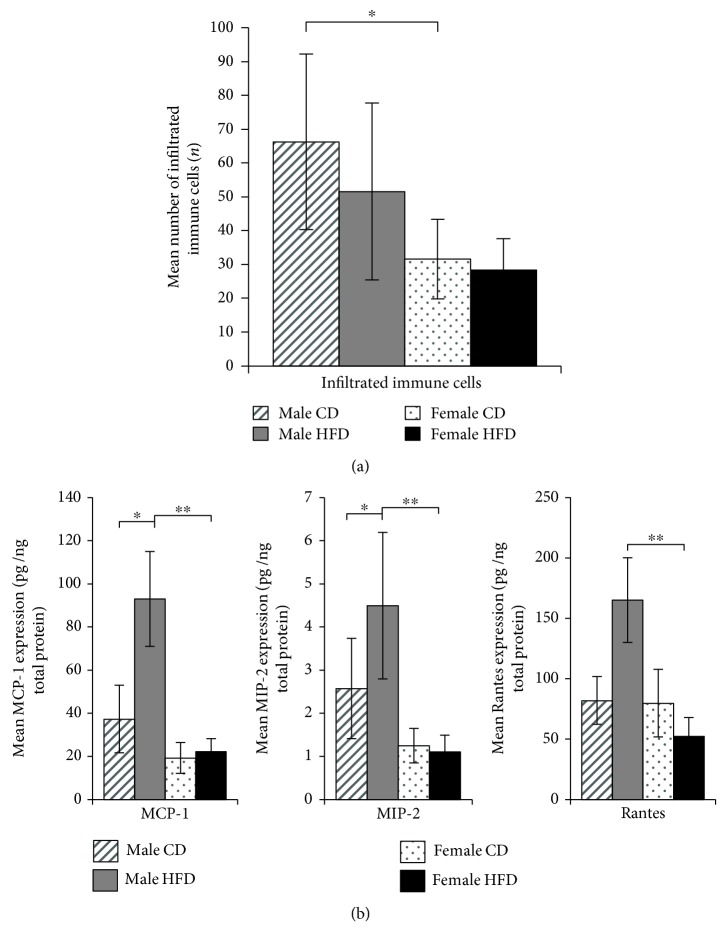
Figure 6.
(a) Resident immune cells in the quadriceps muscles of 21-month-old SD rats. The diagram shows the number of resident immune cells determined by direct microscopy of 10 randomly selected microscopic fields of Masson's trichrome-stained muscle sections of all study animals. Bars indicate the mean numbers of cells ± SD from 12 CD-fed and 6 HFD-fed males (hatched and solid gray bars), as well as 5 CD-fed and 6 HFD-fed females (dotted and solid black bars, respectively). Statistical significance was determined using two-way ANOVA and is denoted by ∗ for p ≤ 0.01. (b) Chemokine expression in the quadriceps muscles of 21-month-old SD rats. The diagram shows the concentration of each indicated chemokine (x-axis) in 1 ng total tissue extract from 21-month-old rats as the means ± SD of 12 CD-fed and 6 HFD-fed males (hatched and solid gray bars, respectively), as well as 5 CD-fed and 6 HFD-fed females (dotted and solid black bars, respectively). Statistical significance was determined using two-way ANOVA and is denoted by ∗ for p ≤ 0.01 and ∗∗ for p ≤ 0.005.

