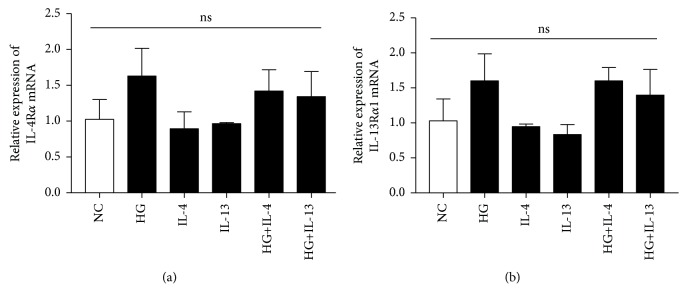
Figure 7.
The relative expression of IL-4Rα mRNA and IL-13Rα1 mRNA. Cells were cultured for 48 h. NC means HK2 cells were incubated with DMEM/F12 alone. HG means HK2 cells were incubated with DMEM/F12 culture medium containing 30 mmol/L glucose. The concentration of IL-4 was 100 ng/mL. The concentration of IL-13 was 1 ng/mL (each group n = 3). ns: P > 0.05 between all groups.

