Figure 5.
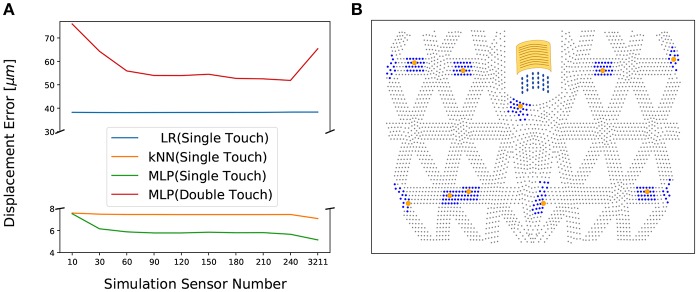
Transfer learning maps the physical sensor values to simulated sensor values: (A) The effect of number of simulated sensors on the prediction precision (of the full displacement map) evaluated with three methods: Linear regression (LR), k-NN, and FNN (FT). Training was conducted on a large set of single-contact data and the reported test performance is for single-contact and double-contact data collected on the real system. The reconstruction net FR was trained on simulated multi-contact data. Twenty-four sensors per physical sensor yielding 240 sensors is optimal for generalizing to double contact prediction. (B) The yellow dots are the centers of physical SGs (optimally selected in Sun and Martius, 2018) and the yellow sheet illustrates the real physical SG. The blue dots around each SG's center are the simulated sensor points (nodes in finite element simulation ANSYS).

