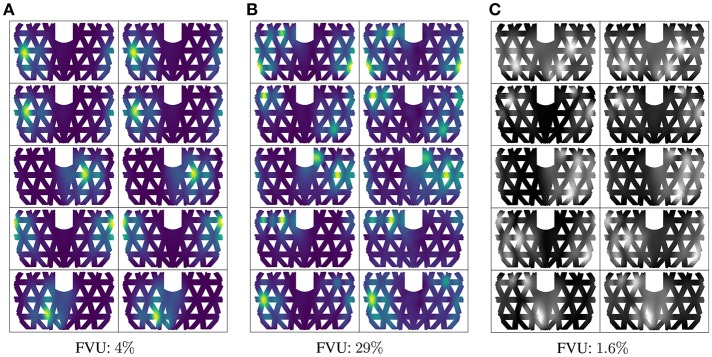
Figure 6.
Deformation prediction results: (A,B) are deformation patterns of single- and double-contact based on the data collected from the real system. Left columns show ground truth (simulation: S to D) and right columns the prediction for random samples (real: R to S to D). (C) shows predicted deformation patterns of triple contact based on simulated sensor values (S to D).

