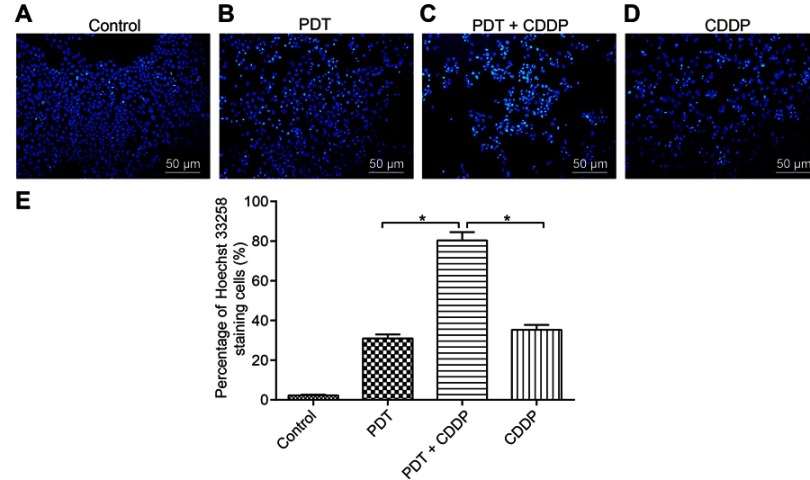
Figure 6.
Hoechst 33258 staining of different cell groups. The blue areas stained by Hoechst 33258 represent nuclei. (A) Control group, (B) PDT group, (C) PDT+CDDP group, (D) CDDP groups. Scale bars represent 50 μm in all images. (E) Percentage of cells with deeply dyed nuclei. Values are expressed as the mean value ± SD, and the experiment was repeated in triplicate (*p<0.05).
Abbreviations: PDT, photodynamic therapy; CDDP, cisplatin.

