Figure 7.
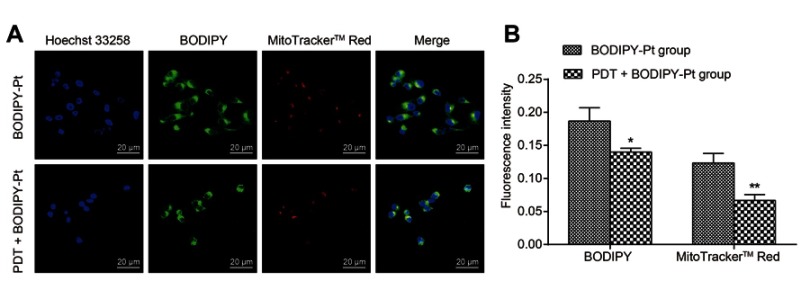
Confocal laser scanning analysis of mitochondrial pathway. (A) Upper panel represents BODIPY-Pt treatment group and lower panel represents the group treated by PDT followed by BODIPY-Pt. Both green and red spots, evoked from BODIPY and Mito Tracker™ Red, respectively, represent mitochondria, while the blue ones stained by Hoechst 33258 represent nuclei. Scale bars represent 20 μm in all images. (B) Analysis of fluorescence intensity which represents the amounts of mitochondria in BODIPY-Pt and PDT+BODIPY-Pt treatment group. Values are expressed as the mean fluorescence intensity ± SD, and the experiment was repeated in triplicate (*p<0.05).
Abbreviations: PDT, photodynamic therapy; BODIPY-Pt, 1,3,5,7-tetramethyl-8-(4-pyridyl)-4,4’-difluorobora-dia-zaindacene labeled platinum conjugate.

