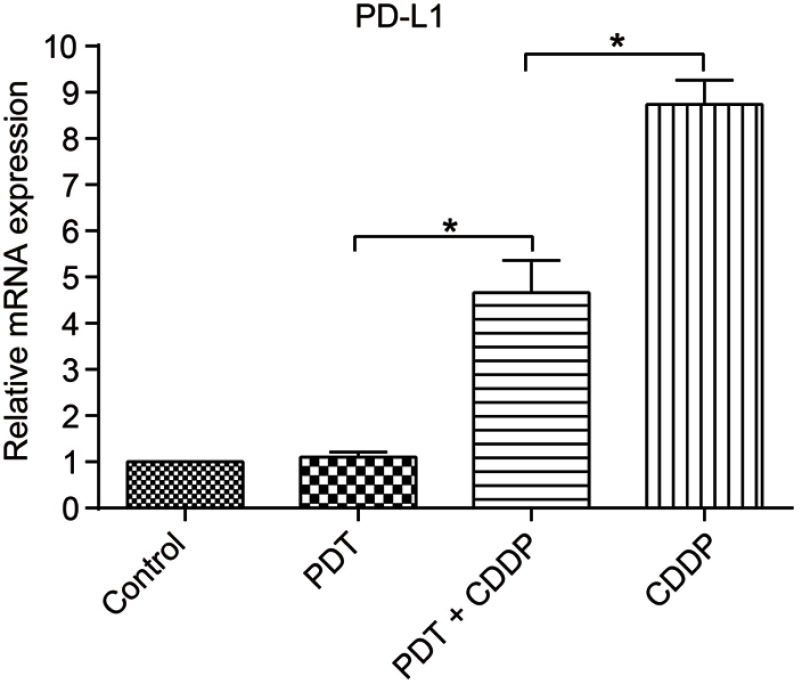
Figure 8.
RT-qPCR analysis of PD-L1 expression in Hep-2 cells in different treatment groups. Data represent the mean value ± SD, and the experiment was repeated in triplicate (*p<0.05). The relative expression was obtained by normalizing to reference gene β-actin.
Abbreviations: PDT, photodynamic therapy; CDDP, cisplatin; PD-1, programmed death receptor-ligand 1; RT-qPCR, real-time quantitative polymerase chain reaction.

