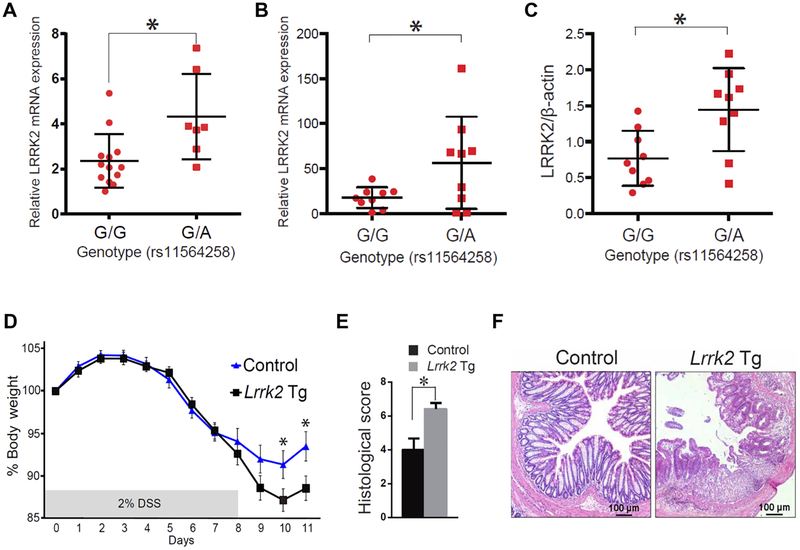
Fig. 1. An increase in LRRK2 boosts inflammation in Lrrk2 Tg mice treated with DSS.
(A) LRRK2 mRNA expression in DCs from patients with CD. (B) LRRK2 mRNA expression in LCLs from individuals with genotype G/G or G/A at SNP rs11564258 [a nonrisk allele (G) and a risk allele (A)]. (C) LRRK2 protein relative to β-actin in CD patients with the same genotypes as in (B). (A and B) LRRK2 mRNA was measured by real-time polymerase chain reaction (PCR). (C) LRRK2 protein relative to β-actin was measured by Western blotting (fig. S1). (A) G/G genotype, n = 13; G/A genotype, n = 7, P = 0.0104; (B) G/G genotype, n = 9; G/A genotype, n = 9, P = 0.04; (C) G/G genotype, n = 9; G/A genotype, n = 9, P = 0.0098. (D) Lrrk2 Tg mice and littermate control mice were fed 2% DSS for 8 days, and body weight was measured. The data represent the average value for each group. n = 12 Lrrk2 Tg mice (Lrrk2 Tg) and n = 14 control mice (day 10, P = 0.0283; day 11, P = 0.0186). (E) Histological score of colon inflammation for Lrrk2 Tg and control mouse groups analyzed in (C). n = 12 Lrrk2 Tg mice and n = 14 control mice (P = 0.0054). Asterisk (*) indicates P < 0.05. (F) Representative photomicrographs of hematoxylin and eosin (H&E)–stained colon tissue on day 11 from Lrrk2 Tg mice and littermate controls. Data are presented as means ± SEM. Statistical significance was determined using an unpaired two-tailed Student’s t test.

