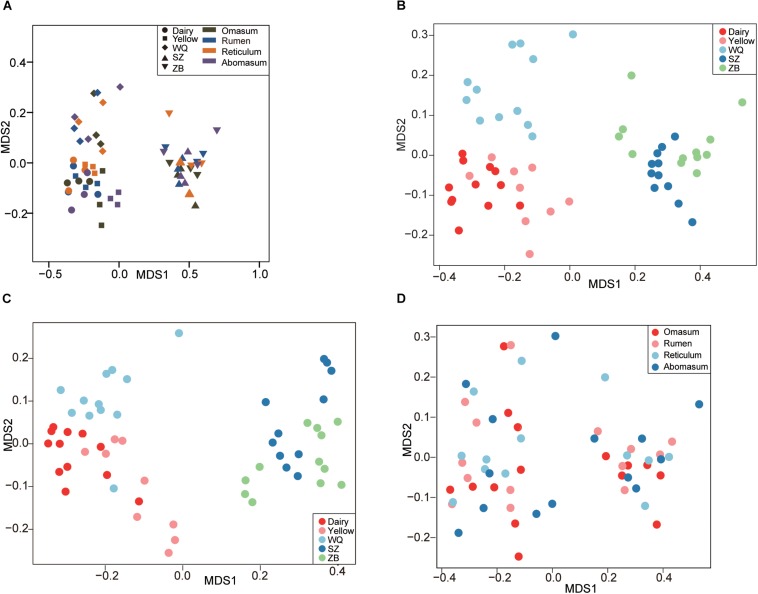
FIGURE 2.
Comparing the stomach microbiota across five breeds. (A) Nonmetric multidimensional scaling (NMDS) plot revealing the effects of breeds and stomach regions based on the Bray–Curtis distance. NMDS plots showing the effect of breed on stomach microbiota based on the Bray–Curtis distance (B), and the unweighted UniFrac distance (C). (D) Comparing the microbiota among the four stomach chambers based on the Bray–Curtis distance. Dairy = dairy cattle, Yellow = yellow cattle, WQ = WQ yak, SZ = SZ yak, ZB = ZB yak.

