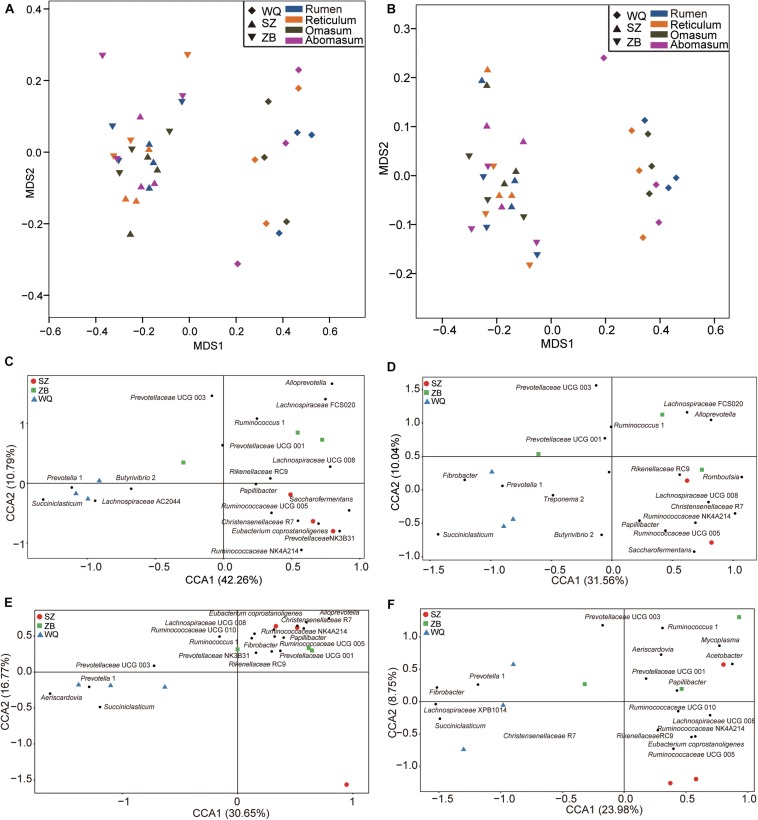
FIGURE 5.
Comparing the microbial community in the four stomach compartments among three yak herds. NMDS plots of the microbiota based on the Bray–Curtis distance (A) and the unweighted UniFrac distance (B). CCA revealing the representative bacteria at the genus level in the rumen (C), reticulum (D), omasum (E), and abomasum (F) across the three yak herds. WQ = WQ yak, SZ = SZ yak, ZB = ZB yak. The representative genus were based on a indicator value >0.5.

