
Figure 2.
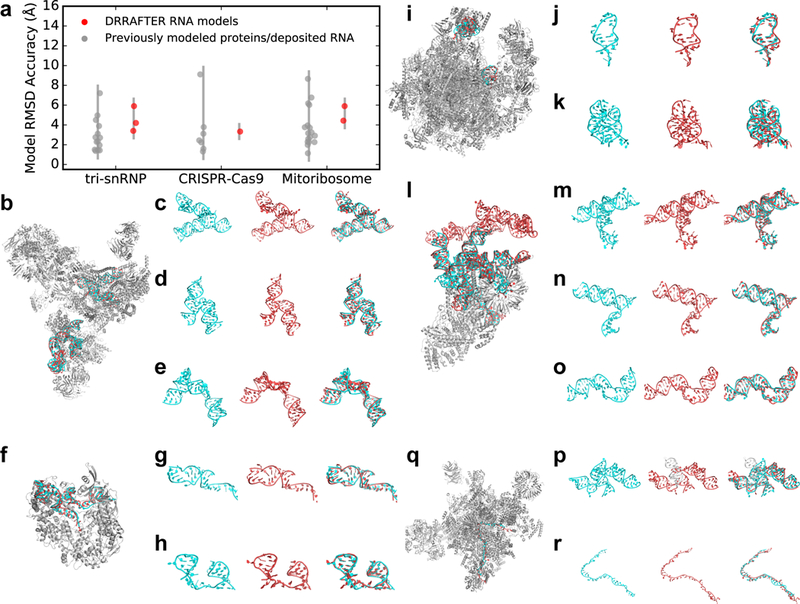
DRRAFTER recovers near-native models over a diverse benchmark set and two blind test cases. (a) RMSDs of DRRAFTER models (red; each region modeled is plotted as a separate point) and previously modeled low-resolution protein and RNA coordinates (gray; each protein or region of RNA is plotted as a separate point) compared with later determined high-resolution coordinates. (b, f, i, l, q) DRRAFTER models built into low-resolution maps (RNA colored red) overlaid with high-resolution coordinates (RNA colored cyan; protein colored silver, PDB IDs listed in parentheses) for (b) the spliceosomal tri-snRNP (5GAN), (f) CRISPR-Cas9-sgRNA complex (4ZT0), (i) mitoribosome (4V19 and 4V1A), (l) yeast U1 snRNP (5UZ5), and (q) yeast spliceosomal P complex (6BK8). (c-e, g, h, j, k, m-p, r) High-resolution RNA coordinates (left, cyan), RNA coordinates from DRRAFTER models built into low-resolution maps (middle, red), and high-resolution coordinates and DRRAFTER models overlaid (right, high-resolution coordinates colored cyan, DRRAFTER models colored red) for the spliceosomal tri-snRNP (c) U4/U6 three-way junction, (d) U5 three-way junction, (e) U5 internal loop II; CRISPR-Cas9-sgRNA complex (g) sgRNA residues 11–30 and 57–68, (h) sgRNA residues 69–99; mitoribosome (j) loop 1, (k) loop 2; yeast U1 snRNP (blind) (m) core four-way junction, (n) yeast three-way junction, (o) SL2–2, (p) yeast four-way junction (DRRAFTER model of SL3–2, SL3–3, and SL3–5 colored red; DRRAFTER model of SL3–4 colored white in order to show one of the unusual strong departures from a reference structure (see text)); yeast spliceosomal P complex (r) ligated exon.