
Figure 3.
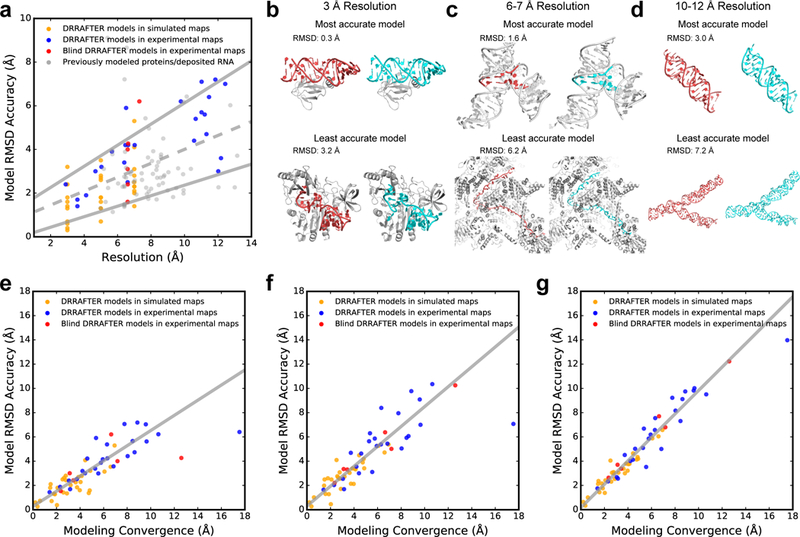
Estimating DRRAFTER model accuracy. (a) RMSD accuracy versus local map resolution (Supplementary Table 1 and Supplementary Table 3) for DRRAFTER models built into high- and low-resolution simulated (gold, N=30) and experimental maps (blue, N=25), blind DRRAFTER models built into low-resolution experimental maps (red, N=6), and previously modeled low-resolution protein and RNA coordinates (gray, N=67). The best-fit line (dashed gray) is given by y = 0.32x + 0.81 (total number of systems = 128). The best-fit upper and lower bound lines (solid gray) are given by y = 0.48x + 1.29 and y = 0.24x - 0.04, respectively (see Methods). (b-d) Examples of the most accurate (top) and least accurate (bottom) DRRAFTER models for maps at (b) 3 Å, (c) 6–7 Å, and (d) 10–12 Å. For each panel, DRRAFTER models are shown on the left with the RNA colored red and the protein colored gray, and the high-resolution coordinates are shown on the right with the RNA colored cyan and the protein colored gray. (b, top) E. coli L25–5S rRNA, (b, bottom) methyltransferase RumA in complex with rRNA, (c, top) yeast U1 snRNP core four-way junction (surrounding RNA residues colored gray), (c, bottom) yeast spliceosomal P complex ligated exon, (d, top) MS2 packaged genome region S9–2, and (d, bottom) region S7. (e-g) RMSD accuracy versus DRRAFTER modeling convergence for (e) the most accurate of the top ten scoring DRRAFTER models (points for DRRAFTER models built into simulated density maps colored gold (N=30); points for DRRAFTER models built into experimental density maps colored blue (N=25); points for blind DRRAFTER models colored red (N=6); total number of systems = 61), (f) the centroid of the top ten scoring DRRAFTER models (colors as in (e)), and (g) the mean RMSD to native across the top ten scoring DRRAFTER models (colors as in (e)). The best-fit lines (solid gray; excluding the two points with convergence > 12 Å: MS2 S15+S16 and blind yeast U1 snRNP yeast-specific four-way junction) are given by (e) y = 0.62x + 0.28, (f) y = 0.82x + 0.30, (g) y = 0.97x + 0.17.