
Figure 4. IHCs from gata3fl/flotof‐cre+/− mice retain an immature basolateral membrane current profile.
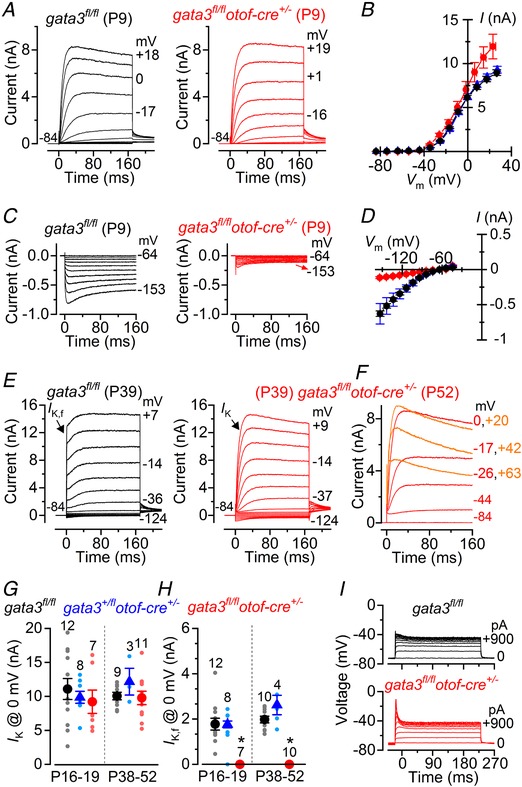
A, outward K+ currents recorded from P9 gata3fl/fl (control) and gata3fl/flotof‐cre+/− (gata3 null) IHCs; voltage protocol as described in Fig. 2 C. B, current‐voltage curves measured at 160 ms from the voltage‐step onset from IHCs of gata3fl/fl (black: P9–P10: n = 19), gata3+/flotof‐cre+/− (blue: P10: n = 3) and gata3fl/flotof‐cre+/− (red: P9: n = 3) mice. C, inward K+ currents (I K1) elicited from P9 IHCs using hyperpolarizing voltage steps in 10 mV nominal increments from –64 mV. D, steady‐state I K1‐voltage curves measured at 160 ms from the onset of the voltage step applied to IHCs from control gata3fl/fl (black), gata3+/flotof‐cre+/− (blue) and gata3fl/flotof‐cre+/− (red) mice; number of cells as in panel B. E, K+ currents from adult P39 IHCs elicited by 10 mV hyperpolarizing and depolarizing voltage steps from –84 mV. F, example of K+ currents recorded from a P52 gata3fl/flotof‐cre+/− IHC showing evidence for the expression of SK2 channels, which are normally expressed only in immature cells; voltage protocol as in panel E. G and H, size of the total K+ current (G) and isolated I K,f (H) recorded from IHCs of all three genotypes just after the onset of hearing (P16–P19) and at adult (P38–P52) stages. I, voltage responses recorded from IHCs elicited by applying depolarizing current injections from their respective membrane potentials.