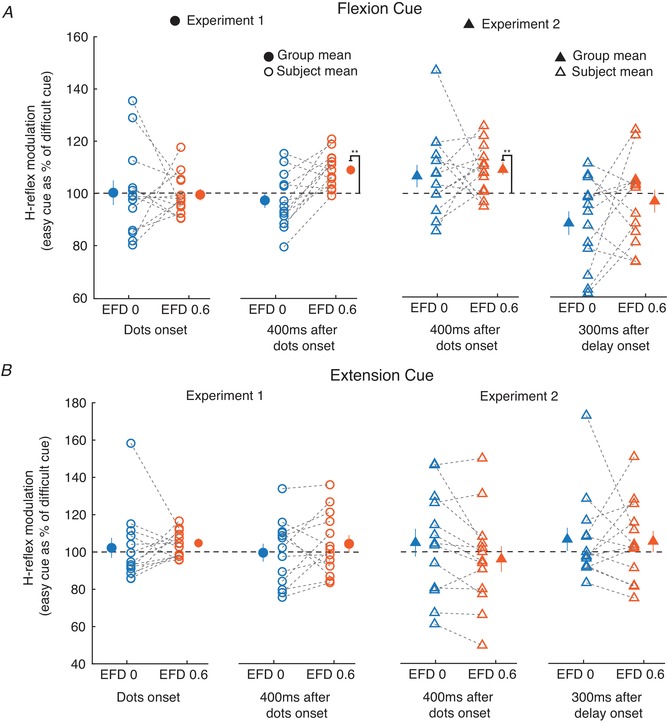
Figure 7. Conditioned H‐reflexes recorded during task performance.

A and B, changes in the facilitated FCR H‐reflex between easy compared to difficult cues for different stimulus timings relative to the task, and for EFD 0 and 0.6 ms. Results are shown separately for when the instructed direction was a flexion (A) or an extension (B). Filled circles and triangles represent grand mean ± SEM (** P < 0.01). Open circles and triangles represent single subject mean. [Color figure can be viewed at wileyonlinelibrary.com]
