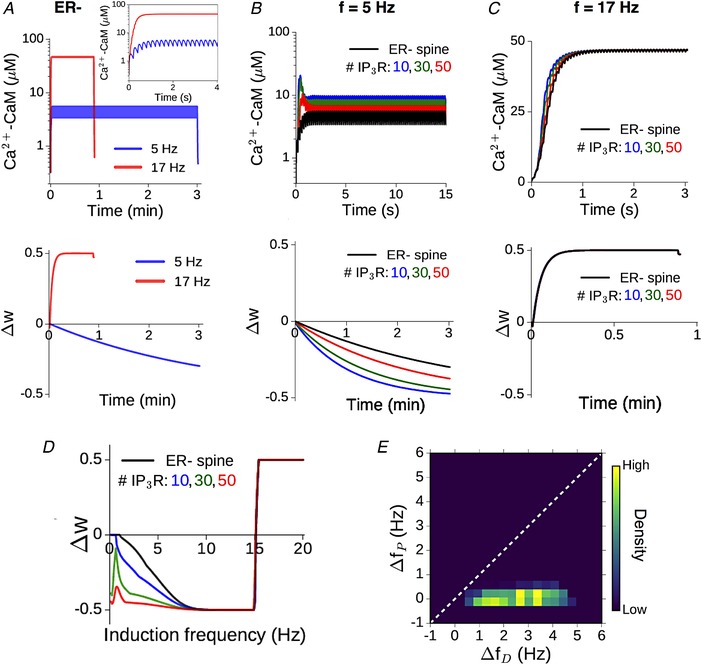
Figure 6. Graded contribution of ICCR to spine Ca2+ modulates the rate‐dependent bidirectional plasticity profile.

A, illustration of the CaM response (top) and plasticity induction (bottom) at the reference ER− spine for 900 presynaptic spikes applied at two different rates, 5 (blue) and 17 (red) Hz. Inset shows a magnified view of the first 4 s of the Ca2+–CaM time course. Plasticity parameters have been adjusted to yield LTD and LTP thresholds f D = 1 Hz and f P = 15 Hz, respectively. B, enhancement of NMDAR‐mediated CaM activation (top) and LTD induction (bottom) at 5 Hz stimulation due to ER Ca2+ contribution for different IP3R cluster sizes. C, time course of CaM activation (top) and potentiation (bottom) at 17 Hz stimulation in the ER− spine (black) and ER+ spine for different IP3R cluster sizes (coloured curves). Due to the suppression of ICCR at higher frequencies, the presence of ER makes little difference in this case. In B and C, only the initial phase of the (much longer) Ca2+–CaM time course is shown for clarity. D, dependence of the total weight change (Δw) induced by prolonged stimulation (900 spikes) on the synaptic input rate at the ER− spine (black) and corresponding ER+ spine for different IP3R numbers (coloured curves); f D = 1 Hz and f P = 15 Hz. Plasticity is enhanced in the ER+ spine at low frequencies, with diminished modulation at higher (LTP‐inducing) rates. E, graded contribution of ICCR to the modulation of plasticity is quantified in terms of the relative shifts in the LTD/LTP thresholds in the ER+ spine (relative to the ER− control spine). The heat map is a distribution of Δf D/Δf P values obtained by random sampling (5000 times) of the plasticity thresholds f D and f P (over 1–6 Hz and 10–20 Hz, respectively), and IP3R number (10–50). (All results for a synapse with NMDAR‐mediated ΔCaEPSP = 0.2 μM.) [Color figure can be viewed at wileyonlinelibrary.com]
