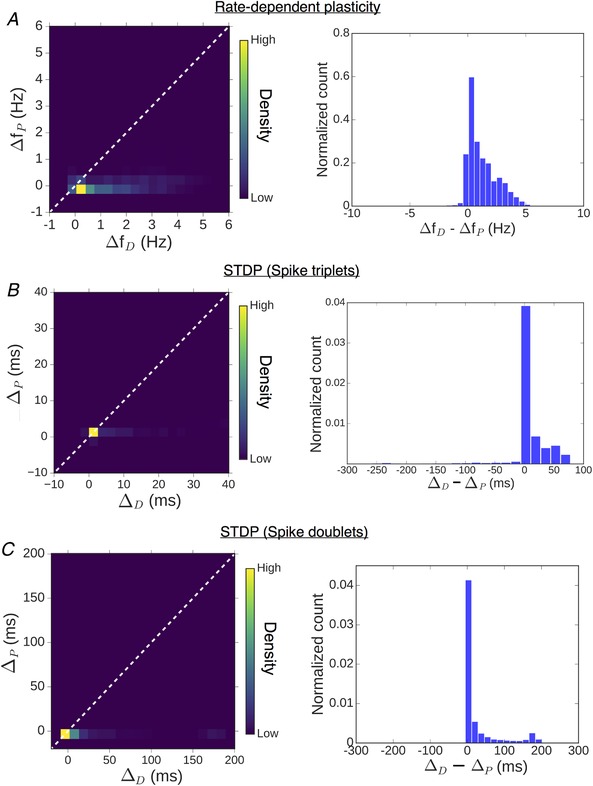
Figure 10. Differential enhancement of LTD and LTP by spine ER is broadly reproduced over a range of realistic parameter settings in our model.

Summary statistics of changes in plasticity windows introduced by ICCR in the case of frequency‐dependent plasticity (A), and for STDP with triplet (B) and doublet (C) spike pairing stimuli. In each case, the left figure is a heat map of the distribution obtained from random sampling of the thresholds at the ER− control spine, over a range of IP3R cluster sizes (10–50) and NMDAR conductances (ΔCaEPSP = 0.1–1 μM); the same information is represented as a 1D histogram of the relative differences (depression vs. potentiation) in the right figure. (For frequency‐dependent plasticity, f D and f P have been randomly sampled over 1–6 Hz and 10–20 Hz ranges, respectively. For STDP, Δt D and Δt P have been sampled from 20 ms windows centered on −35 ms and +35 ms, respectively.) [Color figure can be viewed at wileyonlinelibrary.com]
