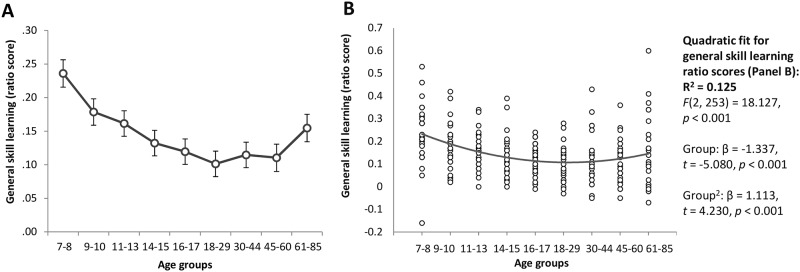
Fig 2. General skill learning ratio scores across the lifespan.
The ratio scores for group averages (A) and individual data (B) are presented. The ratio score can be interpreted as a percentage change in performance (e.g., the 7-8-old age group exhibited an approximately 23% speed-up from Epoch 1 to Epoch 4 relative to their average speed during task). Error bars indicate standard error of mean (SEM).

