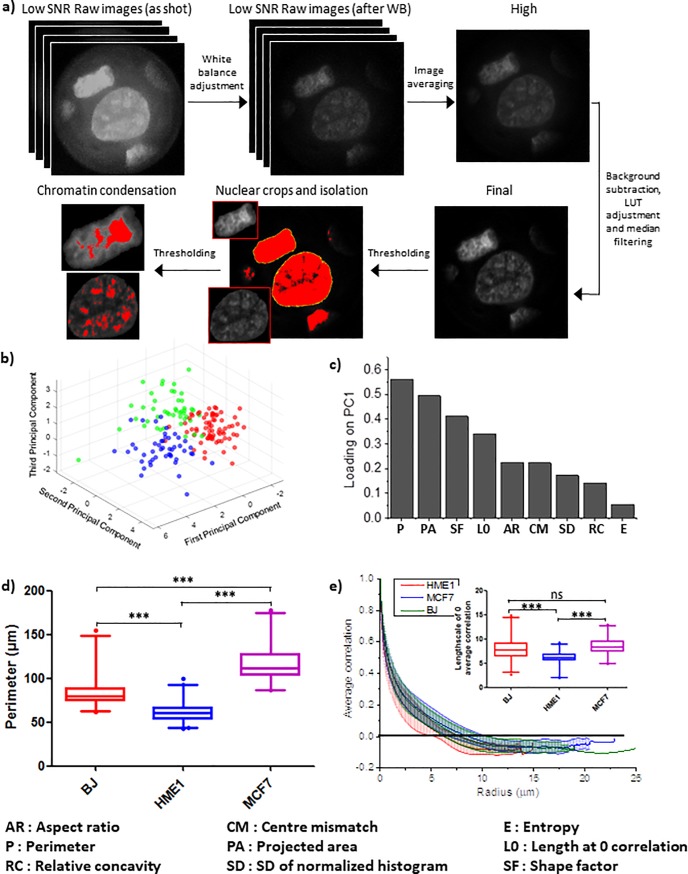
Fig 3. Nucleus segmentation and analysis of chromatin features in mobile microscope.
a) Image processing workflow for the raw and low signal to noise ratio (SNR) images acquired using the mobile microscope. Series of mobile phone images (N ≥ 4) of representative MCF7 nuclei were captured in DNG format and converted to black and white mode. White balance was performed using Adobe Photoshop CC 2018 plugin Camera Raw 10.3. Averaged image was formed upon alignment of the nuclear edges. Final image was generated upon background subtraction, LUT adjustment and median filtering for final noise reduction. Thresholding was then performed for single nucleus isolation and chromatin texture identification. b) PCA plot showing the segregation of BJ, HME1 and MCF7 nuclei in a feature space based on a linear combination of their morphometric and textural features. c) The loading coefficient of each parameter used to obtain the first principle component of the PCA plot in (b). d) Whisker box plots (2.5% to 97.5%) showing the distribution of nuclear perimeter for BJ, HME1 and MCF7. e) Spatial autocorrelation of DAPI intensity as a function of length-scale for BJ, HME1 and MCF7 nuclei (see methods for more details). The lines show the average of all the nuclei of each cell line and the bars represent the standard deviation. The whisker box plots (2.5% to 97.5%) in the insert shows the distribution of length-scales at which the correlation coefficient drops to zero. N: BJ = 54; HME1 = 83; MCF7 = 53.

