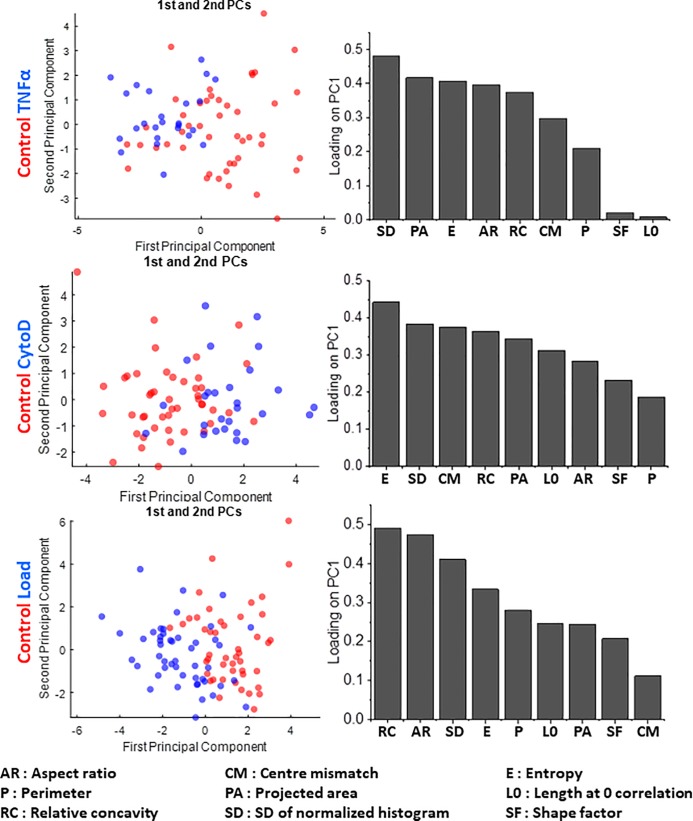
Fig 4. Sensitivity in detecting changes in nuclear and chromatin features upon perturbations in a normal cell line (BJ).
PCA plots (left side) showing the segregation of BJ control cells from those subjected to TNFα (top row), CytoD (middle row) and compressive load (bottom row), together with the respective loading coefficient of each parameter (right side) used to obtain the first principle component. N: BJ control = 54; BJ TNFα = 36; BJ CytoD = 40; BJ Load = 54.

