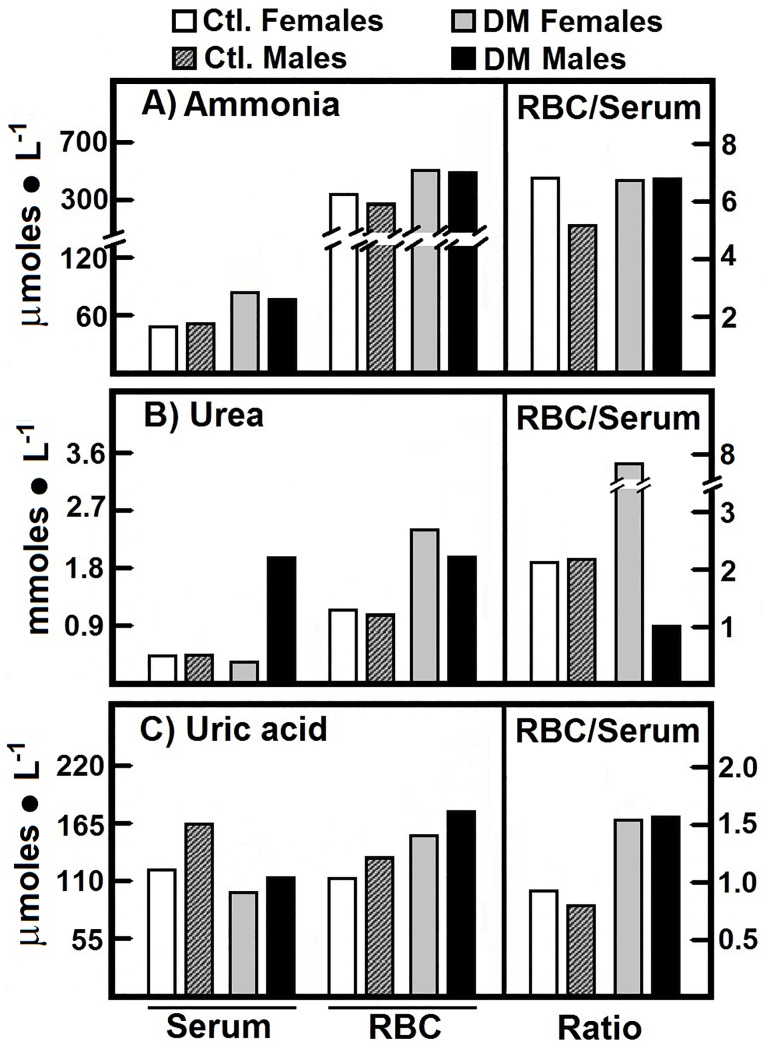
Fig 1. Metabolites participating in nitrogen metabolism quantified in serum and RBC from control subjects and in patients with type 2 DM.
The results are expressed as the medians for levels of ammonia, urea, and uric acid, in healthy control female (n = 40) and male volunteers (n = 40), as well as in female patients with type 2 DM (n = 40) and male patients with type 2 DM (n = 40). Symbols for experimental groups at the top. Descriptive statistics: Most of the distributions were best described by skewed distributions, thus the mean is no longer a good measure of central tendency. Consequently, we relied on the median to compare between sets of data.

