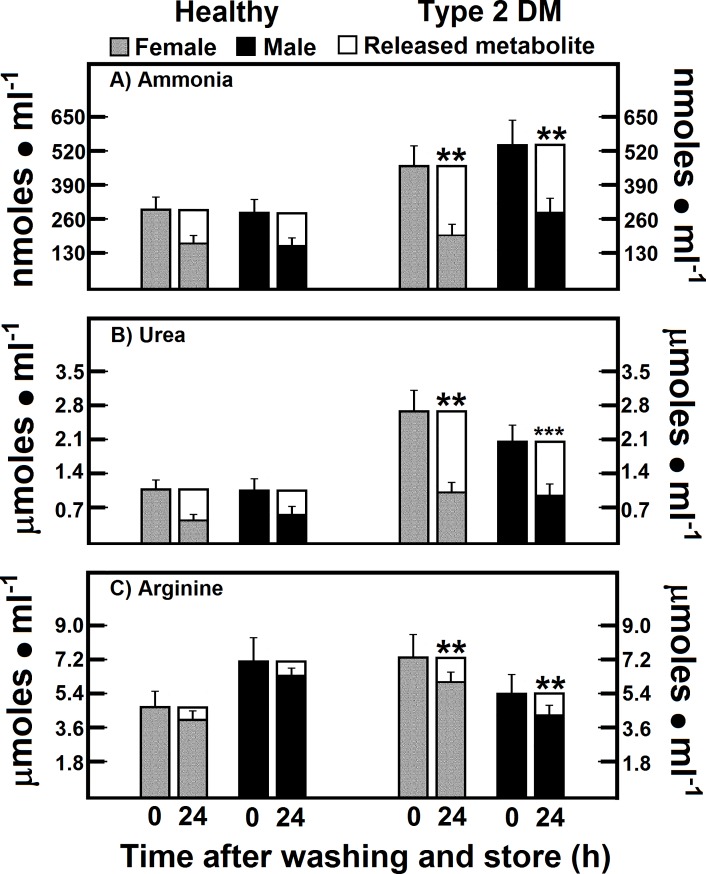
Fig 2. Release of ammonia, urea, and arginine from RBC of patients with type 2 DM after washing and storage.
The results are expressed as the mean ± SD for levels of RBC ammonia, urea, and arginine, in healthy control female (n = 40) and male volunteers (n = 40), as well as in female (n = 40) and male DM type 2 patients (n = 40), at time 0. Empty bars represent the release rate for each metabolite 24 h after washing and storage (time 24). Symbols for experimental groups at the top. Statistical significance: *p < 0.01 against the control female group, and **p < 0.01 vs. the corresponding gender control group.

