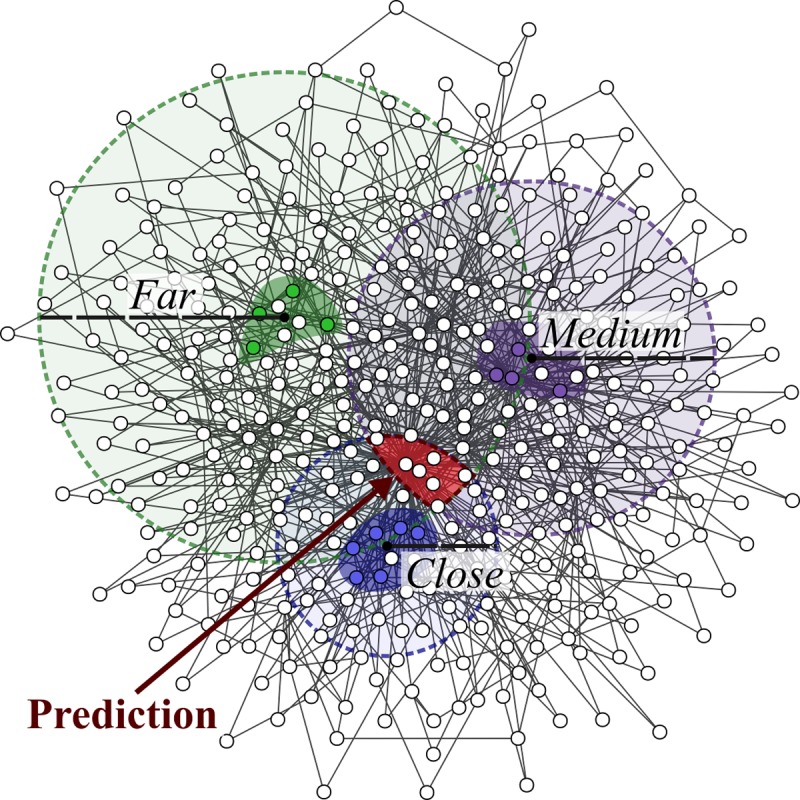
Fig 1. Disease module “triangulation” using disease phenotypic similarity.

The area where the module for a disease with no known genes (the query disease, in red) should be located, is identified using the distance to the modules of three charted diseases (blue, purple and green). Colored nodes represent the disease genes of each charted disease and their disease modules are represented with highlighted backgrounds. The distances between the query and the charted diseases (close, medium and far) are represented by the dashed circles and are related to the phenotype similarity (e.g. highly similar diseases should be close in the graph). The disease module for the red disease should lie in the red area.
