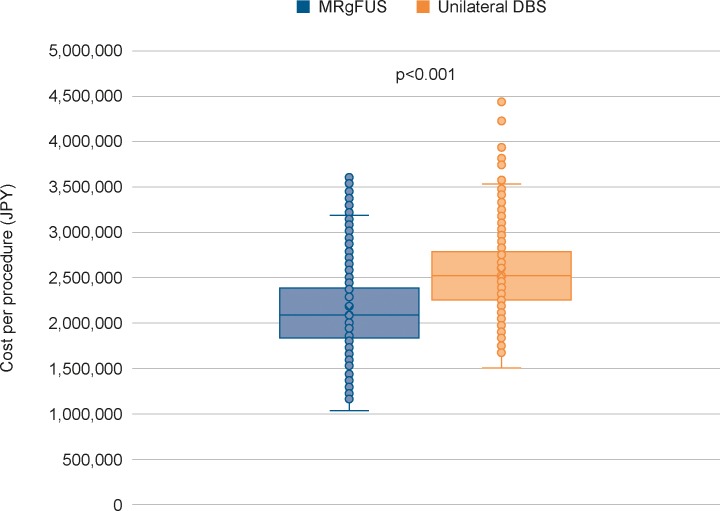
Fig 1. Results of PSA.
Box and whisker plot presenting median per procedure costs for MRgFUS and unilateral DBS. The boxes represent the 1st and 3rd quartiles (interquartile range); lower error bars indicate up to 1.5 times the interquartile range below the first quartile, and upper error bars indicate up to 1.5 times the interquartile range above the third quartile.

