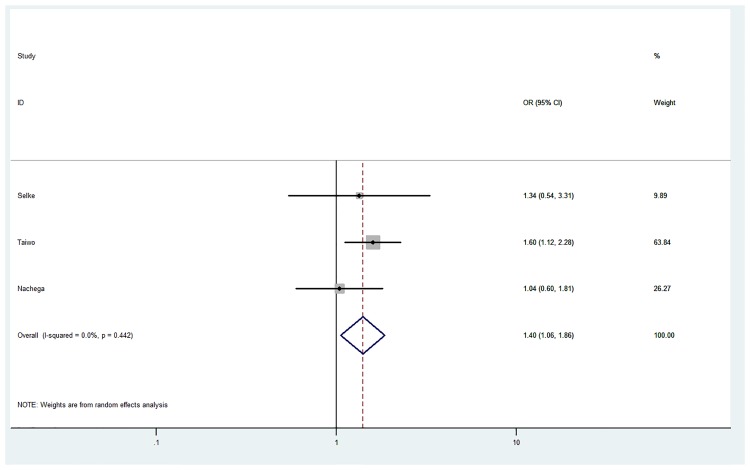
Fig 3. Pooled estimate for the impact of community health workers/lay workers on viral suppression.
The circles represent the point estimate for viral suppression, the size of the grey squares around each point estimate reflect the weight of each study in the average effect size. The horizontal lines represent 95% confidence interval for the point estimate. The diamond represents the weighted average point estimate.

