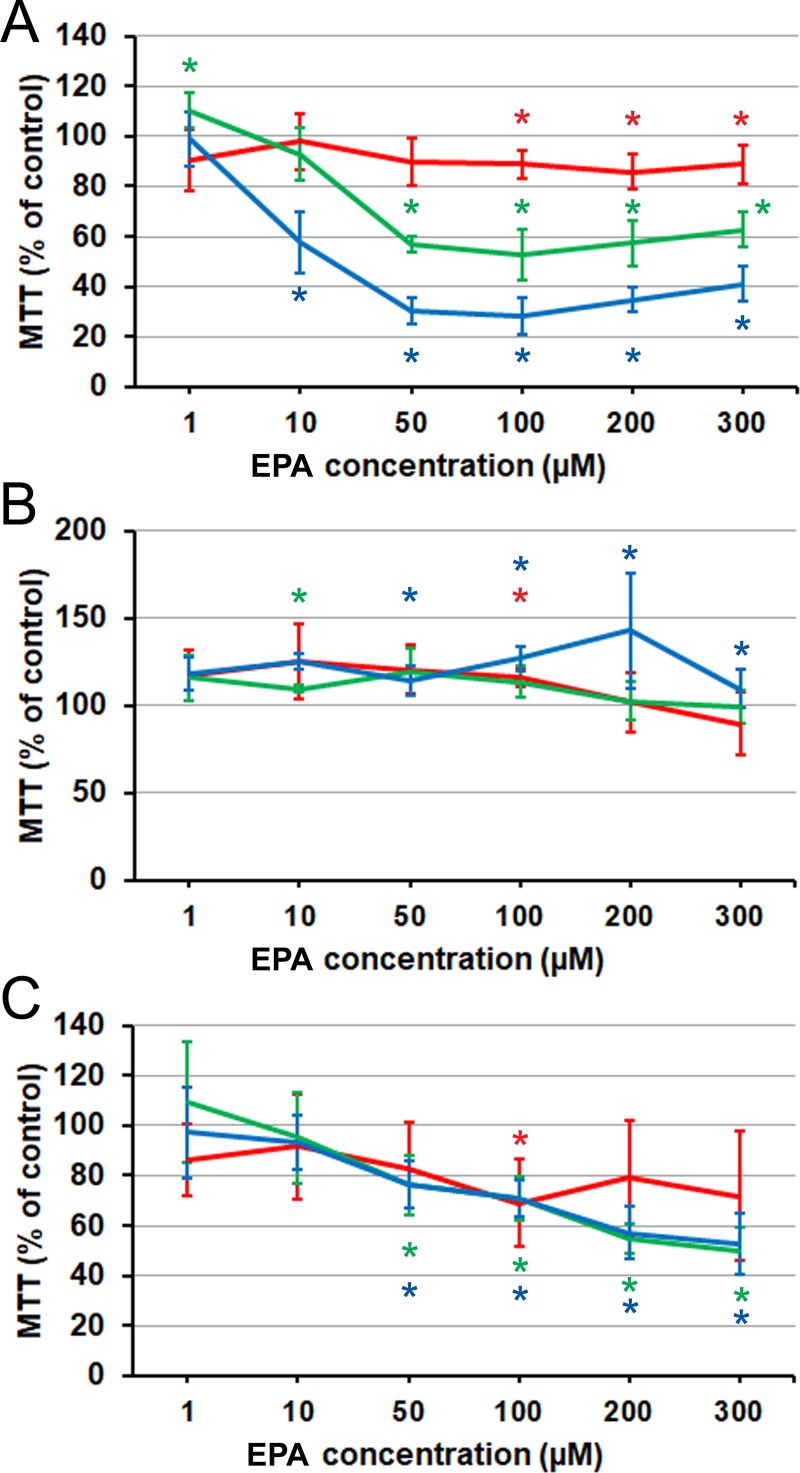
Fig 2. Effect of EPA on prostate cancer cells proliferation and viability as measured by MTT assay.
(A) PC3 cells. (B) LNCaP cells. (C) C4-2 cells. Red line: 24 h. Green line: 48 h. Blue line: 72 h. Error bars: standard deviation. Asterisk: difference from the control is significant on the significance level 0.05, corrected for multiple comparisons. PC3 and C2-4 data: each point is the average of n = 9 cell cultures. LNCaP data: each point is the average of n = 6 cell cultures.

