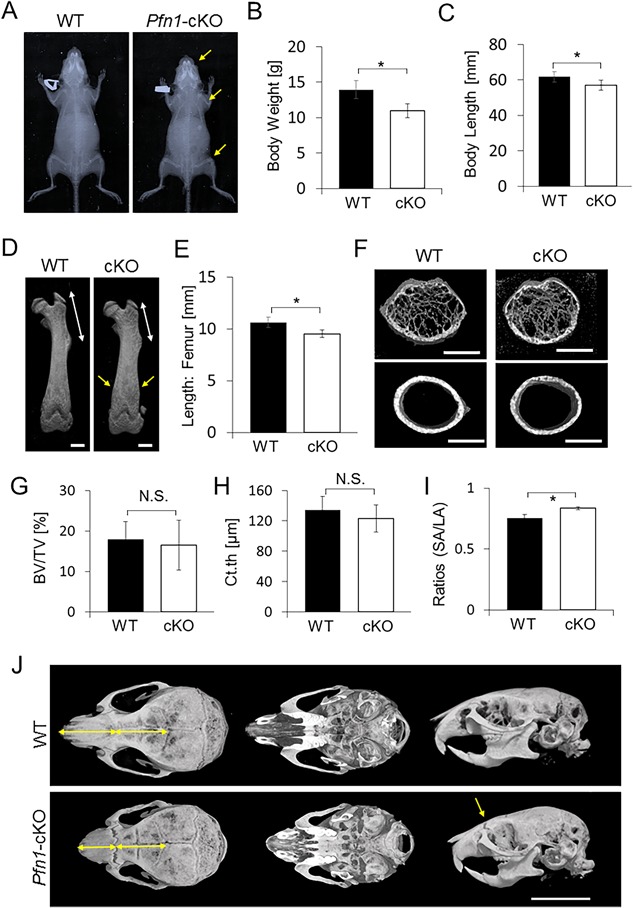
Figure 2.

Postnatal skeletal growth is impaired in the Pfn1‐cKO mice at 4 weeks. (A) Representative plain radiograms of a male WT and the Pfn1‐cKO littermate at 4 weeks. Note that the mutant nose, the distal humerus, and the distal femurs (yellow arrows) are shorter than in WT mice. (B) Body weight was compared in WT and Pfn1‐cKO mice. (C) Body length (nose‐rump length) measured on plain radiograms was compared in WT and Pfn1‐cKO mice. (D) Representative reconstructed 3D‐µCT images of the femurs. Note that the mutant proximal femur (white arrow) is shorter than in WT mice. Note also the altered shape of the distal femur (yellow arrows). Scale bars: 1 mm. (E) Length of the femurs was measured based on the 3D reconstructed µCT images represented by panel D. (F) Representative cross‐sectional views of 3D µCT images of the diaphyseal femurs. Scale bars: 1 mm. (G–I) Trabecular bone parameters of distal femurs were analyzed based on the 3D µCT analysis. BV/TV = bone volume / tissue volume; Ct.th = cortical thickness; SA = shorter axis; LA = longer axis of cross‐sectional femoral diaphysis; N.S. = not significant. (J) Differential facial appearance in upper, bottom, and lateral views of WT and cKO skull were visualized by reconstructed 3D µCT images. Mutant nose is short and straight (yellow arrows). Scale bar: 8 mm. Error bars: SDs. The numbers of WT and Pfn1‐cKO mice were 6 and 5, respectively. Statistical analysis was conducted by Student's t test. *p < 0.05.
