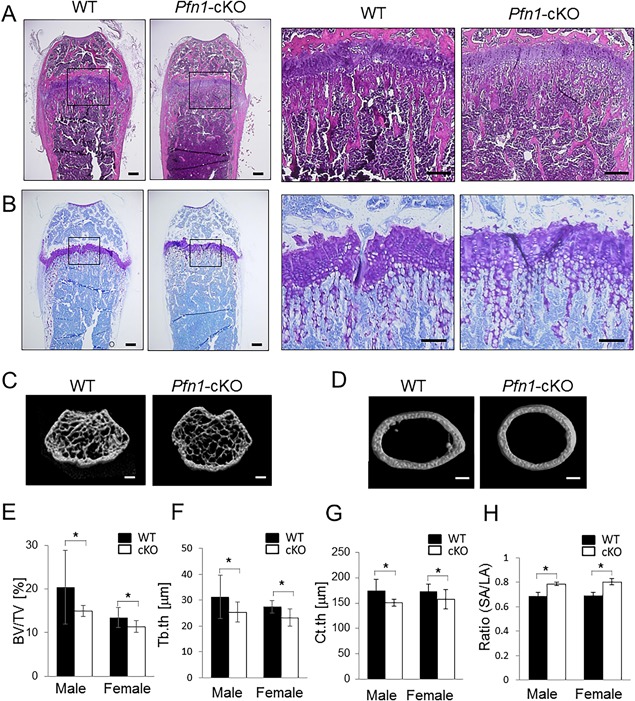
Figure 5.

Long bones are deformed with osteolytic expansion. (A) Frontal section of the distal femurs at 8 weeks of age was compared using hematoxylin and eosin staining. Despite the differences in the bone shape, no significant difference was detected in the growth plate. Right panels represent magnified views of boxed areas in left panels. (B) Serial section was stained with toluidine blue. No obvious difference in columnar structure of the growth plate chondrocytes was detected (see also images of younger mice in Supplemental Fig. 4). (C–H) 3D µCT analysis was performed on WT and cKO mouse femurs. Representative images for distal femur trabeculae (C) and cortical bone structure at midshaft (D) are shown. Trabecular bone volume at distal femur (C) was quantified by bone volume/tissue volume (BV/TV; %) (E) and trabecular thickness (Tb.th; F). Cortical thickness (Ct.th) (G) was analyzed at midshaft. The ratio of shorter axis versus longer axis of the cross‐sectional cortex was compared (H). Scale bars: 200 μm (A,B), and 1 mm (C,D). Error bars: SDs. Statistical analysis was conducted by Student's t test. *p < 0.05.
