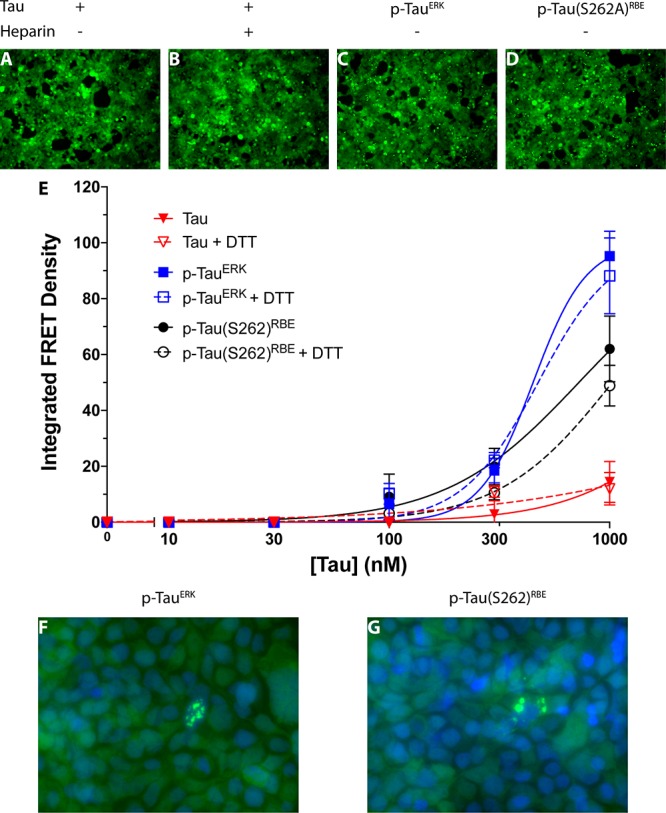
Figure 3.

Induction of tau seeding by freshly dissolved tau in biosensor cells. (A–D) Fluorescence microscopy images of tau biosensor cells incubated with 1 μM freshly dissolved tau (A), tau + heparin (B), p-tauERK (C), or p-tau(S262A)RBE (D). (E) Dose–response analysis of the seeding activity (integrated FRET density) of each tau form in the absence or presence of DTT. (F, G) High-magnification fluorescence microscopy images of cells incubated with 300 nM freshly dissolved p-tauERK (F) or p-tau(S262A)RBE (G). Bright YFP fluorescence indicates tau aggregates. Nuclei were stained with DAPI (blue).
