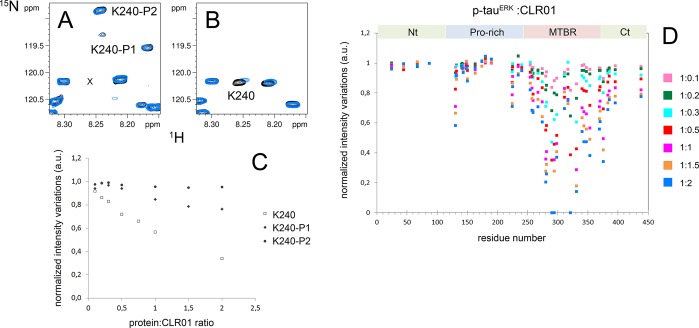
Figure 9.
Binding site analysis of CLR01 on p-tauERK. (A, B) Superimposition of 1H–15N HSQC spectra of selectively 15N-Lys-labeled p-tauERK (A) and unphosphorylated tau (B) at 200 μM in the absence (black) or presence of 200 μM CLR01 (blue). Resonances of K240 corresponding to phosphorylated forms in panel A are annotated by K240–P1 and K240–P2. Note that the unphosphorylated form of K240 shown in panel B is absent in p-tauERK. The location of this missing resonance is indicated in panel A by “x”. (C) Variation of K240 resonance intensity upon increasing CLR01 concentrations for the unphosphorylated form in tau (open squares) and both phosphorylated forms in p-tauERK shown in panel A (filled diamonds and triangles). (D) Changes in resonance intensity of Lys signals in p-tauERK upon CLR01 binding for protein/CLR01 ratios ranging from 1:0.1 to 1:2. For Lys residues close to phosphorylated residues, only intensity corresponding to the resonance in the phosphorylated form is indicated. Nt – N-terminus, Ct – C-terminus.

