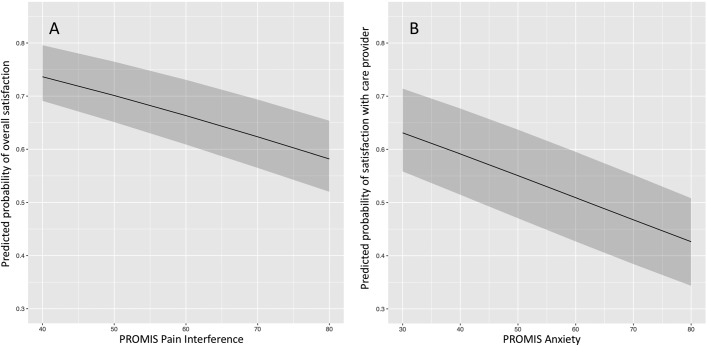
Fig. 2.
Predicted probability (solid lines) with 95% CIs (shaded areas) of patient satisfaction based on pre-visit patient-reported outcome score, in all patients (visit types). Fig. 2-A PROMIS Pain Interference compared with overall satisfaction. Fig. 2-B PROMIS Anxiety compared with satisfaction with care provider.

