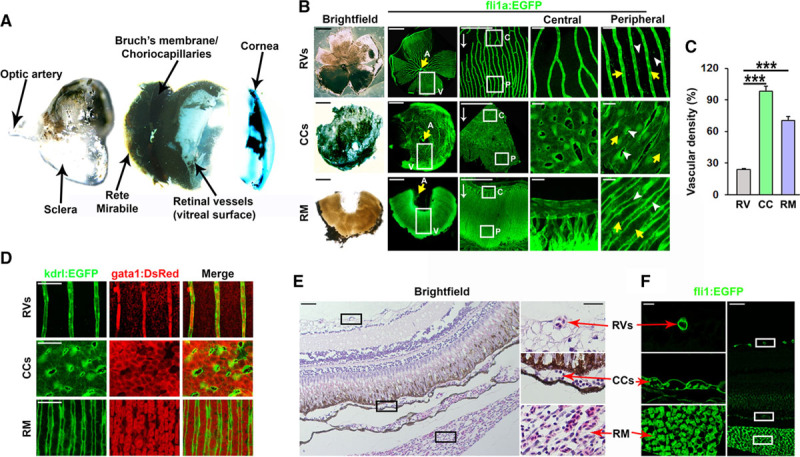
Figure 1.

Anatomy and functional characterization of retinal vessel (RV) and choroid vessel in adult zebrafish. A, Bright-field micrographs showing the gross anatomy of the adult zebrafish eye. The central choroid body containing the rete mirabile (RM) is located between the choriocapillaris (CCs), which is attached to Bruch’s membrane, and the sclera. A loose retinal pigment epithelium is evident between the retina and Bruch’s membrane. The lens, located between the cornea and the retina, has been removed from the preparation. B, Bright-field micrographs of retinal, CC, and RM flat mounts from adult Fli1a:EGFP zebrafish and confocal micrographs of the vessels contained in these tissues (RVs, CCs, and RM, respectively). Boxed regions are shown in magnified images on the right. Central (C) and peripheral (P) vascular beds are shown separately. Yellow arrows indicate arterial branches (A) from the central optic artery, which feed blood to these vasculatures. White arrows indicate the direction of blood flow. Blood is collected by circumferential veins (V). White arrowheads in the column to the right point to interstitial spaces, whereas yellow arrowheads point to vessels/lumens. Size bars indicate 500, 500, 50, 25, or 25 μm in the first row and 100, 100, 50, 25, or 25 μm for row 2 and row 3. C, Quantification of the vascular density of the vasculatures shown in B. n=10–15. ANOVA, P<0.001, Tukey post hoc: ***P<0.001. D, Confocal micrographs of the adult RVs, CCs, and RM of kdrl:EGFP;gata1:DsRed adult double transgenic zebrafish. Endothelial cells are shown in green and erythrocytes in red. Size bars indicate 50 μm in each image. E and F, Bright-field (E) or confocal (F) micrographs of whole retina cross-sections from paraffin-embedded adult fli1a:EGFP zebrafish eyes stained with hematoxylin and eosin. The location of the RVs, CCs, and RM are shown in black or white boxes, and higher magnification images of the boxed regions are shown to the right or left in E or F, respectively. Size bars indicates 20 μm and 50 μm in the high- vs low-magnification images, respectively.
