Figure 2.

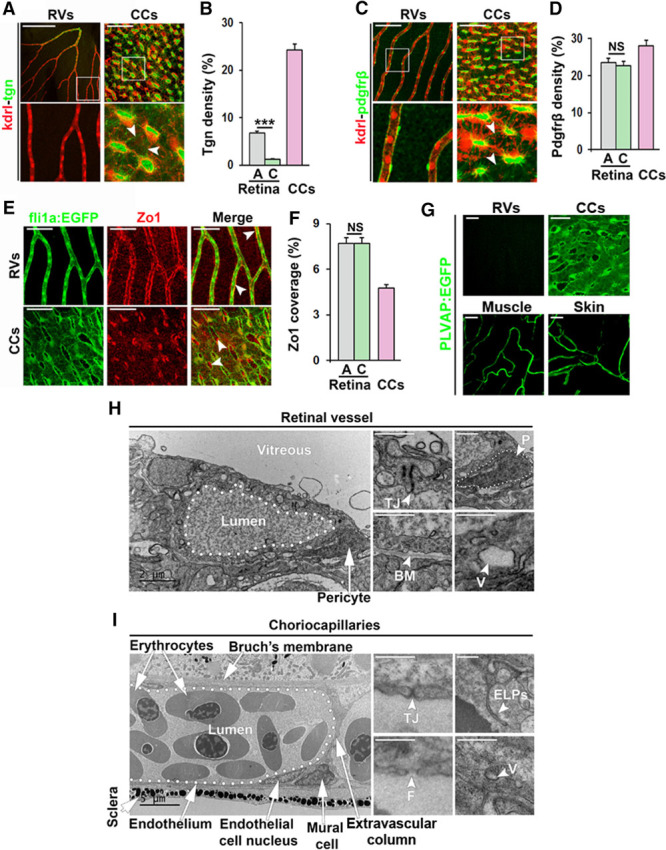
Detailed analysis of retinal vessels (RVs) and choriocapillaris (CCs) in adult zebrafish. A and C, Confocal micrographs of RVs and CCs from Kdrl:DsRed;Transgellin:EGFP (kdrl-tgn [transgellin1]) or Kdrl:DsRed;Pdgfrb:EGFP (kdrl-pdgfrb) double transgenic adult zebrafish. Endothelial cells are shown in red and smooth muscle cells (A) or pericytes (C) in green. Boxed regions are shown in the magnified images below. White arrowheads point to extensions of Tgn+ or Pdgfrb+ perivascular cell projections. Size bars indicate 100 μm for retinal vessels and 50 μm for CCs. B and D, Quantification of the percentage of the EGFP+ endothelium that was covered by Tgn+ (B) or Pdgfrb+ (D) cells in the experiment shown in A and C. n=5–10. ***P<0.001. E, Confocal micrographs of RVs or CCs from Fli1a:EGFP adult zebrafish stained with an anti–ZO (zonula occludens)-1 antibody showing endothelial cells in green and tight junctions in red. White arrowheads point to double-positive signals in the vessel wall. Size bars indicate 100 μm in retinal vessels and 50 μm in CCs, respectively. F, Quantification of the percentage of the EGFP+ endothelium that was stained with the anti–ZO-1 antibody in the experiment shown in E. n=10–15. ***P<0.001. G, Confocal micrographs of RVs, CCs, muscle and skin vessels from plvap:EGFP transgenic zebrafish. Cells expressing PLVAP are shown in green. Size bars indicate 50 μm. H and I, Transmission electron micrographs of RVs (H) or CCs (I). Size bars indicate 2 μm. White arrows/arrowheads point to tight junction (TJ), pericytes (P, outlined with white dots), basement membrane (BM), vesicles (V), fenestrations (F), and endothelial luminal pillars (ELPs) as indicated. A indicates arterial region; C, capillary region; and NS, nonsignificant.
