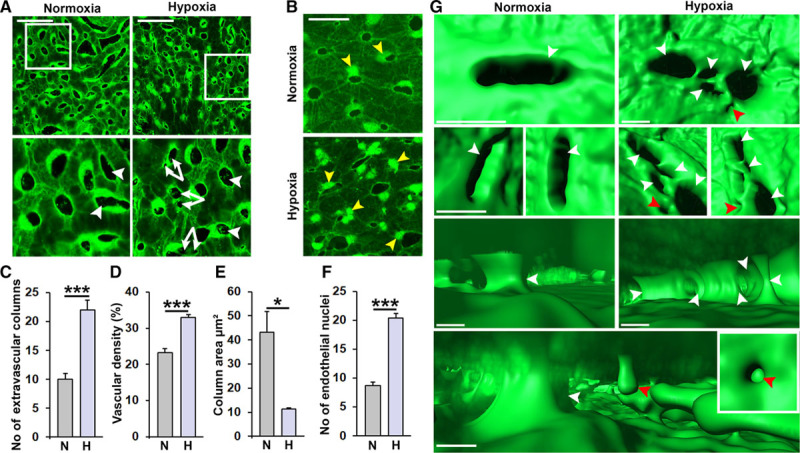
Figure 3.

Hypoxia-induced pathological vascular remodeling in the choriocapillaris (CCs). A and B, Confocal micrographs of CCs from adult fli1a:EGFP (A) or fli1a:nEGFP (B) zebrafish exposed to water with 100% (normoxia) or 10% (hypoxia) relative air saturation for 10 d. Boxed regions are shown in A magnified images below. White arrowheads point to extravascular columns, double white arrows indicate split columns. Yellow arrowheads point to endothelial nuclei. Size bars indicate 50 μm. C, Confocal micrographs of CCs from adult fli1a:nEGFP zebrafish. Quantification of the number of extravascular columns from the experiment shown in A. n=10–15. ***P<0.001. D, Quantification of the vascular density in the CCs from the experiment shown in A. n=10–15. ***P<0.001. E, Quantification of the column area from the experiment shown in A. n=10–15. **P<0.01. F, Quantification of the number of endothelial nuclei per CC area from the experiment shown in B. n=10. ***P<0.001. G, Imaris rendering illustrating the 3-dimensional structure of the vasculature and extravascular columns viewed from outside (top 2 rows) or inside the CC lumen (lower 2 rows) from the experiment shown in A. Image in the lower row is from the hypoxia group. White arrowheads point to full intussusceptive pillars and red arrowheads point to incomplete pillars/endothelial luminal pillars.
