
Figure 4.
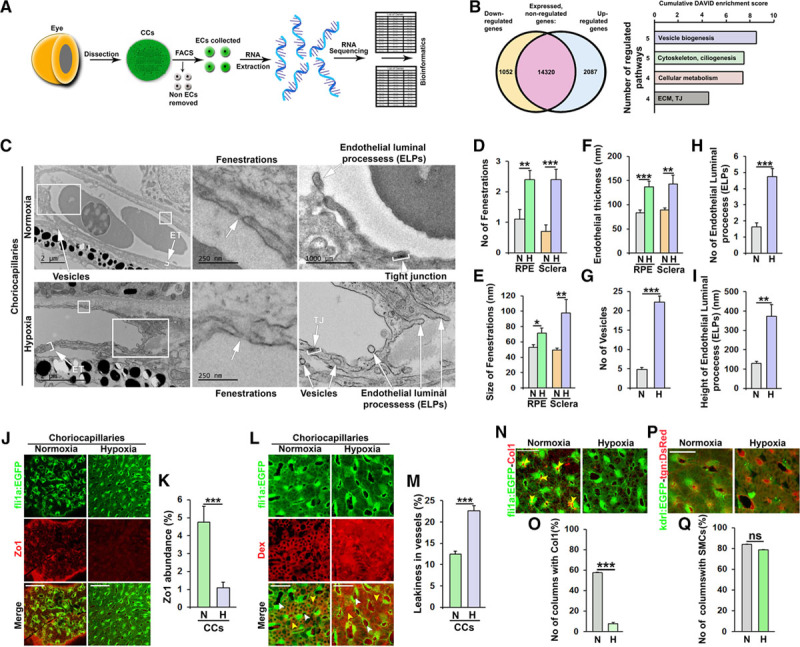
Hypoxia-induced remodeling of the choriocapillary (CC) pillars and endothelium. A, Schematic representation of the processes to obtain and sequence RNA from endothelial cells (ECs, shown in green) in the CCs of adult zebrafish. B, Schematic representation of the hypoxia-induced or hypoxia-repressed transcriptomic changes (P<0.05) in adult CCs ECs and families of functional annotation clusters (each with a DAVID enrichment score >1.0) in which the upregulated and downregulated genes cluster. All clusters are shown in Figure VII in the online-only Data Supplement. The numbers of clusters included in each family and the cumulative DAVID enrichment scores are indicated. C, Transmission electron micrographs from the CCs of adult fli1a:EGFP zebrafish exposed to water with 100% (normoxia) or 10% (hypoxia) relative air saturation for 10 d. Boxed regions are shown in magnified images at the right. White arrowheads point to endothelial thickness (ET), vesicles, fenestrations, tight junctions (TJs), or endothelial luminal processes (ELPs) as indicated. Black size bars indicate 250, 500, or 2000 nm as indicated. D–I, Quantification of the number (D) or size (E) of fenestrations and the endothelial thickness (F), in either the scleral or retinal pigment epithelium (RPE)-sides of the CCs, the number of vesicles (G) and ELPs (H) and the height of the ELPs (I) from the experiment shown in C. n=5–10.*P<0.05, **P<0.01, ***P<0.001. J, Confocal micrographs of CCs from normoxia or hypoxia-exposed adult fli1a:EGFP zebrafish (ECs shown in green) stained with an anti–ZO (zonula occludens)-1 antibody (red). Size bars indicate 50 μm. K, Quantification of the percentage of the EGFP+ endothelium that was stained with the anti–ZO-1 antibody in the experiment shown in J. n=10–15. ***P<0.001. L, Confocal micrographs of adult fli1a:EGFP CCs (ECs shown in green) exposed to normoxia or hypoxia for 10 d and injected with 70 kDa Dextran (Dex, red). White arrowheads point to interstitial spaces, whereas yellow arrowheads point to lumens. Size bars indicate 50 μm. M, Quantification of the relative percentage of interstitial dextran compared to the total signal from the experiment shown in J. n=15–20. ***P<0.001. N, Confocal micrographs of CCs from normoxia or hypoxia-exposed adult fli1a:EGFP zebrafish (ECs shown in green) stained with an anticollagen I antibody (red). Yellow arrowheads point to columns filled with collagen I–positive fibers. Size bars indicate 50 μm. O, Quantification of the number of columns (in percent) containing collagen I fibers in the experiment shown in N. n=10. ***P<0.001. P, Confocal micrographs of CCs from normoxia or hypoxia-exposed adult kdrl:EGFP;tgn:DsRed double transgenic zebrafish (ECs shown in green and smooth muscle cells shown in red). Size bars indicate 50 μm. Q, Quantification of the number of columns (in percent) containing smooth muscle cells in the experiment shown in P. n=10. ECM indicates extracellular matrix; H, hypoxia; N, normoxia; and ns, nonsignificant.