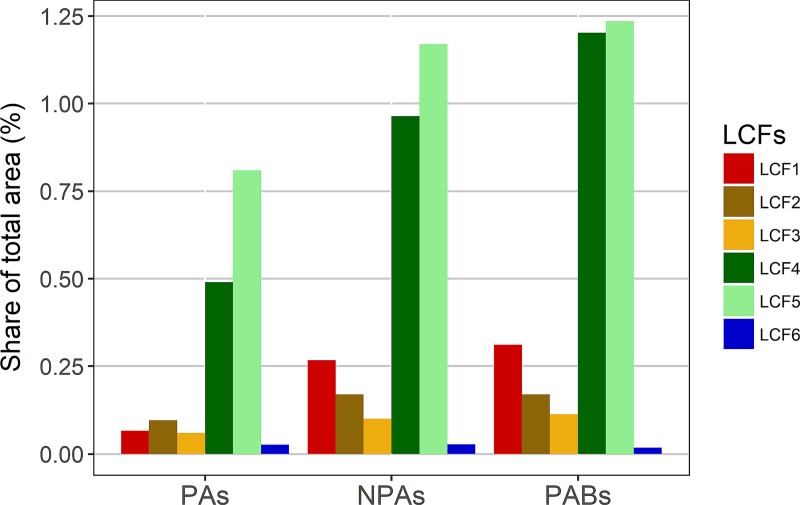
Fig 2. Land cover flows (LCFs) in protected areas (PAs), non-protected areas (NPAs), and 1 km protected area buffers (PABs) as shares of total modelled areas.
LCF1 = Urbanisation, LCF2 = Intensification of agriculture, LCF3 = Extensification of agriculture, LCF4 = Afforestation, LCF5 = Deforestation, LCF6 = Formation of water bodies.

