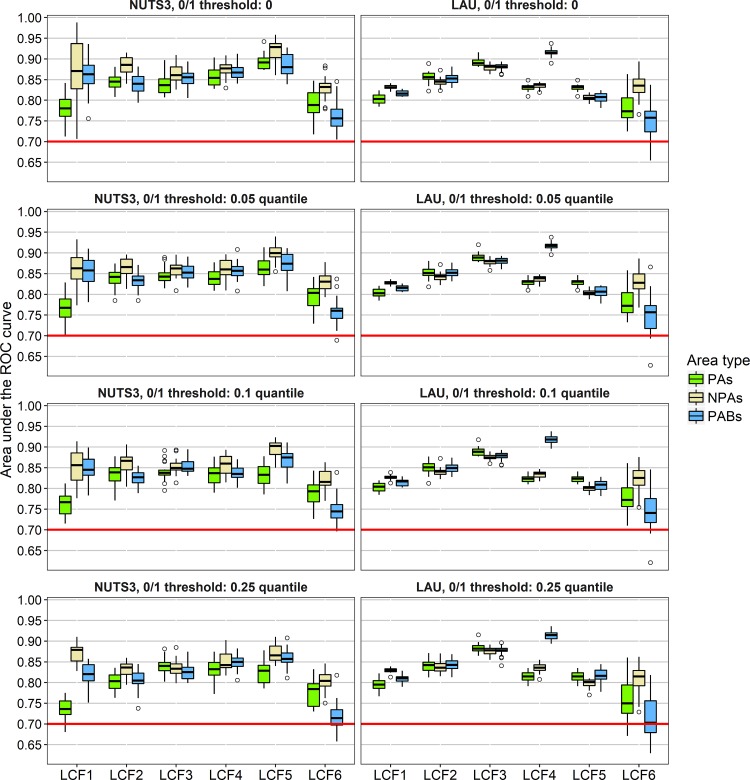
Fig 4. Performances of boosted regression trees at NUTS3 and LAU level.
The red line represents a threshold of 0.7 for the area under the ROC curve, which is exceeded in most model runs. LCF1 = Urbanisation, LCF2 = Intensification of agriculture, LCF3 = Extensification of agriculture, LCF4 = Afforestation, LCF5 = Deforestation, LCF6 = Formation of water bodies.

