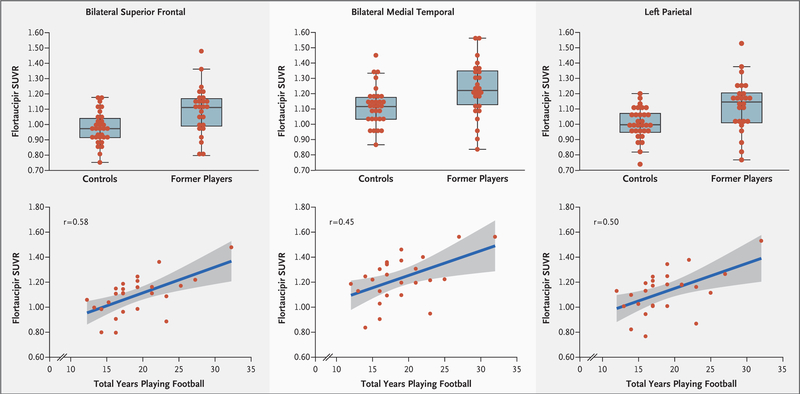
Figure 3. Statistical Evaluation of Regional Flortaucipir SUVRs.
The box plots in the top row show the distributions of statistically characterized regional SUVRs in 26 former NFL players and 31 controls in the bilateral superior frontal, bilateral medial temporal, and left parietal regions of the brain. The horizontal line in each box represents the median, the lower and upper boundaries of the boxes the interquartile range, and the ends of the I bars 1.5 times the interquartile range. The scatterplots in the bottom row show the relationship between regional flortaucipir SUVRs and total years playing tackle football. The gray-shaded areas in the bottom row represent the standard error of the regression line (blue). The r values are based on Spearman correlations of the residuals from age-adjusted partial correlations.

